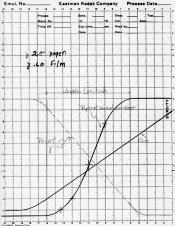
The graphic above is a very rough illustration of an idea.
SBR is scene brightness range, PBR is the paper.
The problem I see is that many people expect what is caught on the negative to translate directly to paper.
Part of what I wanted to illustrate was how the subject matter can carry through and how the paper rather than the negative defines the photo.
Another was to show why/how film under or overexposure loses info. In a related way why there is latitude when negatives are in use.