???
A gradient w/o a curve?
A gradient w/o a curve?
Last edited by a moderator:


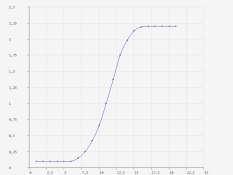
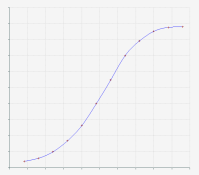
Try using the 21 data points from the aim curve I posted above.
PE
Just some thoughts that struck me today....
1. Yes, EK uses a cubic spline to describe all curves for all products. We used either DEC or HP computers in a room full of automated Densitometers. They were plotting curves from several precision 1B Sensitometers. . . . . In all of my work I have never seen the spline fail!
PE
Try using the 21 data points from the aim curve I posted above.
PE
| Photrio.com contains affiliate links to products. We may receive a commission for purchases made through these links. To read our full affiliate disclosure statement please click Here. |
PHOTRIO PARTNERS EQUALLY FUNDING OUR COMMUNITY:  |