Stephen - didn't you have an article published on flare testing in PhotoTechniques? Which issue was that?
-
Welcome to Photrio!Registration is fast and free. Join today to unlock search, see fewer ads, and access all forum features.Click here to sign up
You are using an out of date browser. It may not display this or other websites correctly.
You should upgrade or use an alternative browser.
You should upgrade or use an alternative browser.
Exposure time for step wedge?
-
A
- Thread starter Usagi
- Start date


Recent Classifieds
-
For Sale Arca Swiss Z1+ fliplock ball head
- Started by Guivd
-
Want to Buy Intellifaucet D250 K250 etc
- Started by Rafal Lukawiecki
-
For Sale RB67 and Graflex odds & ends
- Started by OrientPoint
Forum statistics
Stephen - didn't you have an article published on flare testing in PhotoTechniques? Which issue was that?
Kirk,
The graph in the last post is from the testing I did for that article (although not included in the article itself). The article is Flare and Accurate Film Speeds, PHOTO Techniques, Jan/Feb 2005.
Steve
The fatal flaw of all these systems is the attempt to characterize the HD curve with only the one film speed number.
Nicholas,
I've been pondering over this statement ever since you made it the other day. I'm not sure what you mean by it. Is there a chance you could elaborate on it?
Steve
Jukka,
The next step after exposing and processing the step tablet is interpreting the results. What's considered normal, -1, +1, and so on. And how to judge film speed.
There's more to it than you might think. Using a fixed density to determine speed can be problematic. According to Loyd Jones, "Density, per se, has no significance as an indication of the ability of the photographic material to perform this function. the value of negative density..., for instance, the deepest shadow, is of no consequence except insofar as it may have some bearing on the exposure time required to make a print from the negative." I've gone into more detail on this over at the Understanding ISO thread.
Jones also found an inconsistent relationship between the density range of the negative (DR) and log-H range (LHR) of the paper from the perspective of perceived print quality. A negative with a DR of say 0.85 does not necessarily produce the highest quality print when match to a paper with a LHR of 0.85. Prints from lower contrast scenes were preferred when the DR exceeded the LHR of the paper, and prints from higher contrast scenes were preferred when the DR was less than the LHR of the paper. In addition, the average flare varies depending on the subject luminance range (scene contrast). In other words, the minuses will tend to be too flat for the target paper and the pluses too contrasty. This means that simply finding a given target density 0.30 log-H units up or down isn't sufficient, nor is simply adding or subtracting 0.30 from the Contrast Index equation. The attached Graph 3, which appears to make sense, is less than ideal after considering Jones' findings. The attached Graph 4, compares the resulting Contrast Indexes from four different contrast determination models. The model most consistent with Jones is the Practical Flare Model. Notice how, except for the no flare model, all the normals converge at the same Contrast Index. The variable flare method would be considered the most representative of shooting conditions, but the CIs for the lower contrast scenes (pluses) are somewhat low. The fixed density method produces CIs too low for the high contrast scenes (minuses) and too high for the low contrast scenes (pluses). The compromise is the practical flare method with variable flare coming in a close second.
Of course, this doesn't mean you can't obtain excellent results with other methods. The perception of quality is rather fluid, and papers come in different grades, but if you're going to all the trouble of testing, you might want to maximize the information and control obtainable from the tests.
Last edited by a moderator:
From your posts, I have the impression you've limited yourself to the world of the Zone System.
Yes, I'm not ashamed of it. I'm a ZS practictioner all the way. Of course there are other books and other systems, but I like this one---it's very fluid and very intuitive and it works.
It all boils down to this for me, keep in mind I'm not trying to disprove your claim, only challenging it. You made a claim about the flaws in the ZS regarding its blatant disregard for flare and I'm questioning it-----I'm still questioning it. I'm being very civil here (hard for you to tell in this type communication), but your claim is not proven in my own practical exposure and development procedures. My shadow placements in the field do not have any, or any that is apparent, added density due to flare as you keep insisting that it should. I keep insisting that any flare not eliminated by the lens itself is one of those variables that is accounted for in testing by controlling the extreme values of the desired negative density range.
Also, you have never mentioned how you actually calculate film speed once you determine the speed point.
I've included some attachments to try and illustrate it, easier that way I think. BTW, I'm not concerned with CI measurements either (I know exactly how to graph it, but I don't base any of my ZS testing on it).
What I question is not being open to the facts.
Now, now, just because I question your claim does not mean I am closed to facts. I could be completely wrong, but my practical application of the ZS does not bare that possibility out.
Attachments
Are you guys familiar with Alan Ross' method of testing film by shooting into a black box that has the camera and lens on one side and an array of neutral density filters mounted on the other side? That way, he's testing in the camera and thus it takes lens flare into account. If I had as many blue sky days as he does in Sante Fe I might try something like that. And you don't need expensive Wratten filters for doing something like this, like Alan used when he set his up, you can use good quality theatrical lighting ND sheets.
I never said it doesn't work. Most systems or methods work the majority of the time. What generally denotes the best method is how consistently it works under the broadest range of conditions. Look at all the film speeds throughout the history of the photographic process. Obviously they all worked to some degree since they were all widely used during their time, yet they have been superseded with today's more accurate method. Is today's method better? Yes. Does that mean all photography sucked before? No.
BTW, I use the Zone System for visualization. Except for some personal concerns between the relationship of the Zones associated with the subject and those associated with the print, I feel this was his greatest contribution to the photographic process. I never meant any personal slights for using the ZS, I just have a knee jerk reaction because I've run into too many people who think Ansel is God, when I know that Loyd Jones is the true God of photography.
As for flare, we have to agree to disagree. Whether you've noticed it or not, it exists. All lenses produce flare. Not accepting this isn't necessarily going to negatively affect anyone's photographic quality, but I believe the more information the better.
Take for example someone wanting to process a roll of film in a given chemistry. He asks for the processing time. He's told 8 min at 68 degrees. His film will most likely be fine. Another person asks for a processing time, but he makes a distinction between processing for a diffusion enlarger, or a condenser enlarger, or maybe even for platinum printing, factors the first person wasn't even aware of. Yet both films turned out fine.
I'm not sure if I'm being clear as to what I'm wanting to know regarding the determination of your film speed. You've shown that you find the speed point at 0.10 over fb+f. You've describe how you find it but not how you determine speed from it. Once you find 0.10, do you simply assign an EI to it? I'm confused because in order to determine a speed you need to establish a relationship between exposure and the resulting density. If you're just assigning a EI based on the ISO box speed, that's fine. Beyond the Zone System basically does that. I'm just trying to understand the method you use.
One last thing and I'm not trying to talk you into anything, but there's a very good example in your post of what I was talking about at the beginning of this post. Film speed must have a correlation to image quality. Jones determined the criteria for what people consider to be the best print quality in a series of psychophysical tests known as The First Excellent Print Test. After determining the first excellent print and reviewing the technical characteristics of the negative that produced it, Jones then had to find a way to predictably and consistently reproduce that level of quality without having to perform the tedious psychophysical test with each new film or batch. He looked at all the previous speed methods including the popular inertia, England's 0.10 fixed density, and a 0.20 fixed density, but found that a speed point relating to the slope of the curve produced a negative closest to the quality of negatives in the first excellent print test with the greatest number of different film types under the greatest number of conditions.
The most consistent method was the Fractional Gradient Method where the speed point is found at a point where the film curve's gradient is 0.3 (0.3G) that of the overall gradient. From the perspective of the fractional gradient method, the fixed density method tends to underrate (overexpose) film that is developed to a point lower than the ISO contrast specification and to overrate (underexpose) films that is developed to a point higher than the ISO contrast specifications. (more on this over at Understanding ISO thread)
So what? This is one of the points I was trying to make. From the perspective of the fractional gradient method, the method you illustrate in file tmx&hc110006.jpg isn't as accurate. But the results you get are most likely satisfactory and not being aware of the fractional gradient method hasn't hurt anything. But it exists.
I've found understanding the all the factors and variables has allowed me much more flexibility in my photography and greater peace of mind. I truly believe the more you understand the process, the less likely you are to adhere to dogma. Plus, it has given me a very large photographic BS detection meter.
All the best with your photography, and a reminder that I am honestly curious about how you determine your film speed (mind you, not find the speed point).
Steve
Last edited by a moderator:
Are you guys familiar with Alan Ross' method of testing film by shooting into a black box that has the camera and lens on one side and an array of neutral density filters mounted on the other side? That way, he's testing in the camera and thus it takes lens flare into account. If I had as many blue sky days as he does in Sante Fe I might try something like that. And you don't need expensive Wratten filters for doing something like this, like Alan used when he set his up, you can use good quality theatrical lighting ND sheets.
Kirk,
I'm not. Do you have more information on it?
Steve
Kirk,
I'm not. Do you have more information on it?
Steve
+1
I’m very interested in learning about this method.
Stephen,
By Materials and Processes do you mean Basic Photographic Materials and Processes, 2nd Ed. by Stroebel, Compoton, et. al? There's a more recent third edition, but it looks like the focus has shifted to digital.
Likewise, can you recommend some references to Loyd Jones' work? It looks like Photographic Sensitometry is one book authored by Jones.
Heck, while I'm at it, any other interesting references you'd care to throw in?
Stephen,
By Materials and Processes do you mean Basic Photographic Materials and Processes, 2nd Ed. by Stroebel, Compoton, et. al? There's a more recent third edition, but it looks like the focus has shifted to digital.
Likewise, can you recommend some references to Loyd Jones' work? It looks like Photographic Sensitometry is one book authored by Jones.
Heck, while I'm at it, any other interesting references you'd care to throw in?
I guess my copy must be old, it's just Photographic Materials and Processes.
I know a large section of the first edition of The Theory of the Photographic Process was written by Jones, but the best sources are his published papers. While I've found papers he's written dating back to the early twenties or late teens, the most relevant work begins in the mid-thirties through the late forties.
The first paper is:
Jones, L.A., Russell, M.E., Minimum Useful Gradient as a Criterion of Photographic Speed, Journal of the Optical Society of America, Vol. 2, Dec. 1935.
This paper predates the first excellent print tests so there's no conclusive results, but it does examine the different photographic speed criteria and is an excellent insight into the strengths and weakness of each approach.
Jones defines three criteria as:
1) The exposure required to produce some specified density.
2) The exposure corresponding to the inertia.
3) The exposure corresponding to the point on the density - log exposure curve at some specified value of gradient.
In the paper, he says, "Since a part of the underexposure region of the characteristic curve of the negative material (he means toe) is very generally used in practical work, at least in the amateur field, it must be admitted that such procedure yields a quality of tone reproduction which is satisfactory or at least acceptable. The question then arises as to how much of the underexposure region can be used and still give acceptable results? It seems obvious that this must be answered in terms of gradient, minimum usable gradient, since it is gradient alone which determines the quality of detail (brightness differences) in reproduction. It does not seem possible that the question of how much of the underexposure region can be used can be answered in terms of density which of itself tells absolutely nothing as to the way in which brightness differences (today luminance differences) will be reproduced.
THE paper published in 1939 in two parts is:
Jones, L.A., The Evaluation of Negative Film Speeds in Terms of Print Quality, Journal of the Franklin Institute pt 1, Vol 227, No. 3, March 1939, and pt 2 in April 1939.
In the paper Jones points out the situation for the determination of film speeds, "The problem involves the consideration of subjective factors in addition to those of a strictly objective or physical nature." The tests involved a group of observers determining from a set of prints made from differently exposed negatives. They were to place them in order of worst to best. Jones found that after a certain point, there wasn't a noticeable change in quality. He chose the exposure that made the print that first exhibited a high degree of quality. This psychophysical test is frequently referred to as The First Excellent Print Test.
As part of the evaluation, a set of instructions is needed to help set the judging parameters. Jones considers the expression photographic quality as, "reasonable to assume that this aspect of photographic quality is dependent largely upon the fidelity with which the subjective evaluation of brightness and brightness differences produced in the mind of the observer when viewing the original is reproduced in his mind when he views the reproduction. However, it is not safe to assume, in all cases, that a precise reproduction of the original subjective impression is that which the observer would accept as the best possible photographic quality, for he might be more pleased with a reproduced subjective impression into which some distortion has been introduced."
From this test comes most of modern tone reproduction theory.
Jones, L.A., Nelson, C.N., A Study of Various Sensitometric Criteria of Negative Film Speeds, Journal of the Optical Society of America, Vol. 30, No. 3, March 1940.
This paper comes after the first excellent print test and the corresponding papers. It examines a number of various speed criteria in relation to the results obtain from the first excellent film test to determine which method "will yield results in close agreement with those obtained by the direct psychophysical method" of the first excellent print test.
His conclusion was "from the standpoint of tone reproduction theory there seems to be no justification for the adoption of any value of density as a significant criterion of the speed of a photographic negative material. The primary function of the negative material is to record brightness differences existing in the scene. Density, per se, has no significance as an indication of the ability of the photographic material to perform this function. the value of negative density by which any particular object brightness is rendered, as, for instance, the deepest shadow, is of no consequence except insofar as it may have some bearing on the exposure time required to make a print from the negative."
"Tone reproduction theory indicates that there is only one characteristic of the negative curve that is significant in expressing the capacity of the material to reproduce brightness differences, and it is upon the way in which brightness differences are reproduced that the quality of the final positive must depend. This characteristic of the D-log E (today D-log H) relationship is the gradient or slope, since this determines the magnitude of the density differences by which brightness differences in the object will be rendered in the negative and eventually in the positive made therefrom."
Next came a series of papers exploring various factors such as subject luminance range and daylight illuminance.
Jones, L.A., Condit, H.R., The Brightness Scale of Exterior Scenes and the Computation of Correct Photographic Exposure, Journal of the Optical Society of America, Vol. 31, No. 11, November 1941.
In this paper, Jones defines the average luminance range of exterior scenes and average flare and proposes an equation for exposure. Over an eighteen month period in the late 1930s, under many different conditions and within a two to three hundred mile radius of Rochester, they photographed a total of 130 scenes of which 126 were represented in the study. The scenes included beach scenes, distant landscapes, snow scenes, street scenes, gardens, architectural subjects, and exterior portraits. The direction of the light in most scenes was frontal having avoided back-lighted and strong cross-lighted scenes because of the difficulty of measuring the influence of flare under those conditions. In addition to the direction of light, the illumination was classified as sunlit, haze, light cloud, or heavy clouds.
The average SLR derived from the 126 sample scenes was 1:160 (2.2 log units), with a standard deviation of 0.38. This means that 68% of the scenes fell within a 2½ stop luminance range of the average, while 95% fell within a 5 stop luminance range. The luminance ranges of the scenes tested were from a minimum 1:27 (1.43 log units, approx. 4⅔ stops) to a maximum 1:750 (2.88 log units, approx. 9 ½ stops).
The average flare must also be defined because of its effect on the luminance range of the scene at the film plane. Jones found 80% of the magnitude of the flare factor originates from the subject. The two primary aspects of the scene that influence flare are the luminance range, and more importantly, the distribution of luminance values within the scene.
In two rather long and tedious papers, Jones defines Daylight (definitively). They're good for the background information and to understand the many factors that are considered, otherwise the last part of the second paper is worth it for the exposure equations (although later papers by other authors are more relevant with updated versions of the equations). Many of the ASA/ANSI standards tend to be release around the same time as the release of new scientific papers. The first ASA standard for light meters came around the time of these papers.
Jones, L.A., Condit, H.R., Sunlight and Skylight s Determinants of Photographic Exposure, Journal of the Optical Society of America, Vol. 38, No. 2, 1948.
Jones, L.A., Condit, H.R., Sunlight and Skylight as Determinants of Photographic Exposure. II. Scene Structure, Directional Index, Photographic Efficiency of Daylight, Safety Factors, and Evaluation of Camera Exposure, Journal of the Optical Society of America, Vol. 39, No. 2, Feb 1949.
Then there's the one that relates all that negative/real world phenomena stuff to printing.
Jones, L.A., Nelson, C.N., Control of Photographic Printing: Improvements in Terminology and Further Analysis of Results, Journal of the Optical Society of America, Vol. 38, No. 11, November 1948.
The reference to the word "further" in the title is to another paper by Jones on printing from 1942. The 1948 paper defines the relationship between the negative and the print in psychophysical terms as to what best combination of paper and negative produces "first-choice prints". This paper basically defines paper grades and the the matching of the negative density range to the paper exposure range.
There are a couple surprising conclusions in the paper. Jones finds "because of the influence of the brightness distribution (current use luminance) and subject matter in the scenes photographed, an accurate prediction cannot always be made of the exposure scale (exposure range) of the paper which will give a first-choice print from a negative of known density scale...hence the value of negative density scale (negative density range) cannot be an unambiguous guide for the selection of the grade of paper to be used in making a print of first-choice quality." In other words, matching the density range of the negative to the log exposure range of the paper doesn't always yield the optimum print.
He also found what he calls a "surprising rule." "For the soft papers, the density scales of the negatives should in most cases exceed the sensitometric exposure scale of the paper (log exposure range), whereas, for the hard papers, the density scales of the negatives should in most cases be less than the sensitometric exposure scale of the paper." This is what I was referring to in a previous post.
My proposed Practical flare model of development determination is based on this concept. I've written a paper on this topic which no one wanted to publish. The graph from that post comparing the different developmental models is from that paper.
Some where in his paper Jones basically says that even though there's no perfect, unambiguous relationship between the negative and print and consequently no ideal method, what choice do you have but to come up with the best method given what you got.
There's also a nice paper that helps to explain psychophysics as it relates to photography.
Jones, L.A., The Psychophysical Evaluation of the Quality of Photographic Reproductions, PSA Journal, Vol. 17, Dec. 1951.
Those are the authoritative papers by Jones that still define the photographic tone reproduction theory. Of course, there are more relatively current papers of note.
Last edited by a moderator:
Part 2
The following three papers are good reference papers.
Todd, H.N., Zakia, R.D., A Review of Speed Methods, Photographic Science and Engineering, Vol. 8, No. 5, Sept-Oct 1964.
Allbright, G.S., Emulsion Speed Rating Systems, Journal of Photographic Science - Proceedings Issue.
Roberts, C.J.V., Photography Before Hurter and Driffield, Journal of Photographic Science, Vol. 39, 1991.
The next two papers preceded and help to explain the changes in the 1960 ASA b&w film speed method.
Nelson, C.N., Safety Factors in Camera Exposures, Photographic Science and Engineering, Vol 4, No. 1, Jan-Feb 1960.
Nelson, C.N., Simonds, J.L., Simple Methods for Approximating the Fractional Gradient Speeds of Photographic Materials, Journal of the Optical Society of America, Vol. 46, No. 5, May 1956.
"Simple Methods" is very important in that it defines the underlying mathematical precepts used in the 1960 standard. I feel a major misinterpretation of the concept of film speed exists today because the findings of this paper have been forgotten. It concludes that there is a direct correlation between the more accurate fractional gradient method and a fixed density and they proposed an equation. The paper proposes a method referred to as the Delta-X Criterion equation for calculating approximate fractional gradient speeds from a fix density method. The speed standards since 1960 all automatically incorporate this into them but only when adhering to the normal contrast conditions stated in the standard. What happens when the Delta-X Criterion isn't applied to contrast conditions above or below normal development? This is where over 90 percent of photographers are mistaken about film speed. As Nelson notes in "Safety Factors" referring to the Delta-X Criterion, "The fixed-density criterion tends to underrate (overexpose) films that are developed to a lower average gradient and to overrate (underexpose) films that are developed to a higher average gradient." This occurs because fractional gradient is based on the slope of the shadows and not a fix density point. As processing changes, the fractional gradient point shifts up and down in relation to a fixed point such as 0.10. According to fractional gradient theory, there is, in effect, only one film speed for a given film-developer combination (within at least the -1 to +2 range).
Another of the unpublished papers I've written is on the Delta-X Criterion. There's also more details about Delta-X over at the Understanding ISO settings thread (including the equations and an example).
For the more hard core, fact and math heavy (but applicable to practice) are:
The hard to find
Holm, Jack, Exposure-Speed Relations and Tone Reproduction, IS&T 47th Annual Conference, ICPS 1994.
and the not so hard to find
Dunn, Jack, Developments and Trends in Practical Exposure Determination, Journal of Photographic Science, Vol. 6, 1958.
Two of the must have papers if you really want to understand the relationship of light meters and exposure theory. In fact, Stimson, the author of the second paper, was the chairman on the subcommittee for the 1971 ANSI standard on general purpose exposure meters (ANSI PH3.49-1971). A great deal of the standards appendix is lifted directly from Stimson's paper. Also, in an graph attached to an earlier post, I illustrated the effect flare had on exposure. The non-flare curve and flare curve were generated using the equations from Connelly's paper.
Connelly, D, Calibration Levels of Films and Exposure Devices, Journal of Photographic Science, Vol 16, 1968.
Stimson, Alan, An Interpretation of Current Exposure Meter Technology, Photographic Science and Engineering, Vol. 6, No. 1, Jan/Feb 1962.
Two last papers of note. I believe the first is the standard for the fractional gradient method before there as an ASA/ANSI. The second is the paper accompanied the announcement of Kodak's Contrast Index method.
Author unknown, American Standard Method for Determining Photographic Speed and Speed Number, Journal of the Optical Society of America, Vol. 33, No. 8, August 1943.
Niederpruem, C.J., Nelson, C.N., and Yule, J.A.C., Contrast Index, Photographic Science and Engineering, Vol. 10, No. 1, Jan/Feb 1966.
Of course, there's a number of good books out there:
The Manual of Photography, Jacobson, Ray, Attridge, Axford, Focal Press.
Exposure Manual, 4th edition, Dunn and Wakefield
Appied Photographic Theory, Kowaliski
Sensitometry for Photographers, Eggleston
Photography, It's Materials and Processes, Neblette
Exposure, Theory and Practice, Berg
Controls in Black and White Photography, Henry
Photographic Sensitometry, The Study of Tone Reproduction, Todd and Zakia
The Theory of the Photographic Process, Third Ed.
The above list of papers took me years to track down (mostly discovering they existed). Almost all were found in the stacks of my local university. I hope you find this helpful.
Last edited by a moderator:
.... and a reminder that I am honestly curious about how you determine your film speed (mind you, not find the speed point).
Your're kidding me right?

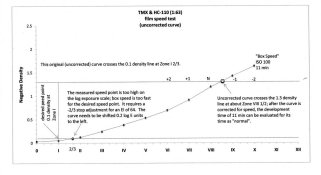
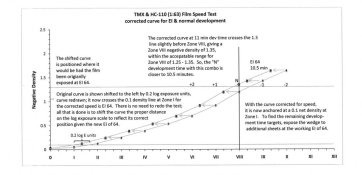
Observe where the original curve reaches a net density of 0.1 on the log exposure scale or the zone scale, note the difference between that point and the target speed point of 0.1 net density at Zone I. In the new example given, that difference is one full stop, so one full stop is taken from the box speed for a new EI of 50.
Since a log exposure interval of 0.3 is equivalent to a one stop or one zone exposure difference, it's a simple matter to determine the new EI based off of this fact. There's another attachment to show a different example and the film testing procedures I learned are straight out of the book shown.
It's been an interesting discussion and good luck in your photography as well---I think we've beat this one into the ground enough. We've probably bored a few folks but, oh well.
Chuck
Attachments
With all of the references cited above, I'm surprised that you have not referred to the work of Jim Bartleson and Ed. Breneman. That has some implication on this espeically on the perception of a scene being dependant on background or surround. Jim was a close personal friend until his untimely death, and we used to meet regularly to discuss topics such as this and how to devise suitable algorithms for testing. The work of Mike Kriss is also relevant as contrast and edge effects are important here, and along with that the work of DeMarsh is of some importance as well.
BTW, many of the references before about 1960 are considered rather obsolete today.
PE
BTW, many of the references before about 1960 are considered rather obsolete today.
PE
With all of the references cited above, I'm surprised that you have not referred to the work of Jim Bartleson and Ed. Breneman. That has some implication on this espeically on the perception of a scene being dependant on background or surround. Jim was a close personal friend until his untimely death, and we used to meet regularly to discuss topics such as this and how to devise suitable algorithms for testing. The work of Mike Kriss is also relevant as contrast and edge effects are important here, and along with that the work of DeMarsh is of some importance as well.
BTW, many of the references before about 1960 are considered rather obsolete today.
PE
I actually have a paper by Bartleson and Breneman, but I couldn't list everything and my primary interests are in exposure and tone reproduction theory. Besides, no one is stopping you from offering up specific information yourself. I think that would be more helpful than nit-picking someone who does.
Bartleson, C.J., Brenenman, E.J., Brightness Reproduction in Photographic Process, Photographic Science and Engineering, Vol. 11, No. 4, July-August 1967.
Well, there really weren't many papers concerning b&w much after the mid 1960s, and Jones is still the foundation for pretty much all of tone reproduction (I tend to assume b&w in my posts). Many of the terms have changed and some of the variables, but the rest is sound especially conceptually. Jones was the first chairman for the ASA committee Z38 which was established to standardized the field of photography. During his tenure as chairman, there were 113 approved standard. While there's tweaks to most of the standards over the years, most having to do with the specialties of Jones are still sound, such as the speed standard and light meter standard. I happen to have every light meter standard going back to the military in WWII. Substantively, after 1948, they've changed very little. Subject luminance range is the same, daylight illuminance is still the same, and the exposure equation (apart from looking different and with a different value for q) is still the same. How can you begin to understand speed without understanding the first excellent print test or understand the current ISO film speed standards relationship to the fractional gradient method? Jones is core, unfiltered source material. Jones is also more chatty in his papers than what is common in more modern technical papers so you tend to get a better background explanation and not wall to wall numbers.
CPorter, no I'm not kidding. I understand this stuff pretty well. I believe we are simply not connecting. Most probably we are using different photographic terminology. Remember all the meter candle second stuff from before? Remember the example about the two people with different levels of experience wanting development times? I'm asking about the determination of speed and not simply finding the speed point. You keep repeating how you find the speed point. Still, you have answered my question or to be more precise confirmed my theory. Thank-you for your indulgence.
Stephen: thanks much for the references and annotations!
Ron: the same request over again! If you have any "seed" references for those authors, or relevant book(s) which reference their papers in context as a jumping off point, I'd greatly appreciate it.
[Shortened rant: After some quick online digging for Stephen's references, I'm saddened that engineering publications still haven't freed up access to their archives. I've found nothing comparable in the traditional engineering areas I've investigated to resources such as CiteSeer or the ACM Digital Library, or even basic web searches for computer science papers and authors.]
John;
That is essentially the problem. The SPSE Journal requires membership in ICIS (International Congress of Imaging Science) and since it went mosly digital (and I retired) I have let my membership lapse. I can't see spending all that money on digital doooo dooo as a retiree. Sorry.
But a google of Jim Bartleson and Ed Breneman or Mike Kriss should bring up some articles. Most of them were published back when it was the SPSE (Society of Photographic Scientists and Engineers).
I am continually asked to post references, but unfortunately, I tossed years of journals when I retired never believing that I would need them. In fact, for a few years, I was in charge of disposing of Kodak employees discarded journals. We used to collect them and ship them to universities and 3rd world country's libraries for use there to teach imaging science.
What irony that today I wish I had them. I have about 5 issues left in the whole house. At one time I had box upon box of them and Popular Photography and Darkroom Techniques going back to the 60s. Sorry.
PE
As a side note, remember that there is no exact in-camera exposure for a step wedge. It is assumed that centering a step wedge is proper, but this only works for a MacBeth color checker which is adjusted to give mid tones and proper speed when the scale is centered.
If you do this with a full step wedge you can be badly misled as all it does is move the steps back and forth on a scale of 0-3 or 0-6 density units. You need a centered scale or a reference object to know that you have done good.
Having spent half a lifetime nearly, immersed in this for 2000 hours a year (approximate work hours in a year for budget purposes ) for nearly 40 years, I think I have paid my dues. This can be done with our without the math, but if you only do it with the math, you have no practical "proof" of concept.
PE
If you do this with a full step wedge you can be badly misled as all it does is move the steps back and forth on a scale of 0-3 or 0-6 density units. You need a centered scale or a reference object to know that you have done good.
Having spent half a lifetime nearly, immersed in this for 2000 hours a year (approximate work hours in a year for budget purposes
) for nearly 40 years, I think I have paid my dues. This can be done with our without the math, but if you only do it with the math, you have no practical "proof" of concept.PE
As a side note, remember that there is no exact in-camera exposure for a step wedge. It is assumed that centering a step wedge is proper, but this only works for a MacBeth color checker which is adjusted to give mid tones and proper speed when the scale is centered.
PE
Could you go into this some more? I'm interested in how the MacBeth color checker works.
- Joined
- Aug 22, 2006
- Messages
- 1,532
- Format
- Multi Format
I have to say, I've found this interesting so stayed up late for a bit of reading fun (yes, it really is).
I do have some reservations about this method, exposing a sensi wedge inside of a camera, as part of a film speed test. Maybe someone can comment on these points?
1) As Stephen (I think) pointed out, light falloff due to being off-axis of the lens will certainly have an effect on the resulting curve. Is this considered when one evaluates? It seems like it ought to be fairly easy to estimate and make rough corrections, Or is it possibly insignificant?
2) Since the film curve(s) will be evaluated, I presume, to determine the degree of development (meaning contrast, or gamma, or whatever one uses), won't Callier effects come into play? I'm assuming use of a silver wedge, which will see a semi-collimated light source (the lens pupil), so the wedge would seem to have more light stopping power than a densitometer would indicate. The questions, like before, are: do corrections need to be made or does the effect turn out to be insignificant?
3) Finally, this test does not show the effect of lens flare. (How could it? It's not being used to form an image) So how does one compensate? OR do you just find out later that there is a bit more shadow density than you expected, then make a slight speed adjustment? Or is this insignificant?
Just curious if these things have been considered. I've never read Phil Davis, but somehow I have confidence that he has already considered these issues.
I have to say, I've found this interesting so stayed up late for a bit of reading fun (yes, it really is).
I do have some reservations about this method, exposing a sensi wedge inside of a camera, as part of a film speed test. Maybe someone can comment on these points?
Bill, you have posed some excellent questions!
1) As Stephen (I think) pointed out, light falloff due to being off-axis of the lens will certainly have an effect on the resulting curve. Is this considered when one evaluates? It seems like it ought to be fairly easy to estimate and make rough corrections, Or is it possibly insignificant?
I don't think you can just apply a light fall off factor to the results. The only way to determine the light fall off of the lens is to take measures at the back of the camera. You would then have to have a reference strip exposed without the light fall off and another one from the back of the camera to include the light fall off as a comparison as well as carefully making sure they are both processed exactly the same. From my perspective, why introduce such unknowns and difficulties. A test is done to eliminate all the variables except for the ones you are testing for. A film test is done to test the film not the lens.
2) Since the film curve(s) will be evaluated, I presume, to determine the degree of development (meaning contrast, or gamma, or whatever one uses), won't Callier effects come into play? I'm assuming use of a silver wedge, which will see a semi-collimated light source (the lens pupil), so the wedge would seem to have more light stopping power than a densitometer would indicate. The questions, like before, are: do corrections need to be made or does the effect turn out to be insignificant?
Callier effect doesn't factor in when contacting although point spread function could, and not only in the exposure but in reading the resulting densities. That's why the tests need to be contacted emulsion to emulsion and the results read through the emulsion.
The Callier effect comes into play when testing the paper in order to determine the paper's log exposure range which then becomes the aim for the negative density range. (although it isn't a perfect relationship)
3) Finally, this test does not show the effect of lens flare. (How could it? It's not being used to form an image) So how does one compensate? OR do you just find out later that there is a bit more shadow density than you expected, then make a slight speed adjustment? Or is this insignificant?
Flare, one of my favorite subjects. First, in a film test, you don't want flare. You want to know about the film not flare. That's one of the reasons why the step tablet is contacted. Flare is factored in after. Flare affects the film in two ways. It increases the shadow density to a proportionally greater degree than the highlights. This effectively increases the film speed, and reduces the apparent contrast of the film. Both factors need to be taken into account.
Flare is practically impossible to determine for any specific shooting situation. The degree of flare in a scene is primarily attributed to the scenes luminance range. The greater the range, the greater the flare. But the value of flare can also vary because of the distribution of tones within the scene even if the range of values remains constant. A large white area surrounding a small black square will have a higher flare value than a large black area surrounding a small white square. So, the flare value is estimated based on tests. The difficulty in determining and controlling flare is the other reason you don't want to include it in with the film test.
The statistically average scene has an average flare of 1 to 1 1/3 stops (0.30 to 0.40 log-H units). I've found 0.34 log-H is generally used for most exposure equations, but Kodak changed from 0.34 to 0.40 for their contrast determination. How do these flare values influence my film speed and contrast determination?
All film would be a little over a stop slower without the influence of flare. Flare adds exposure to the shadow exposures. A statistically average scene with a normal tonal distribution, flare adds 0.34 or 1 1/4 stop exposure to the film. A non average scene could add more or less making the film slightly slower or faster for that scene. As flare is variable depending on the scene, it is virtually impossible to perfectly predict where the shadows will fall.
Average flare is factored into ISO speed determination. Speed point, which is the point where film speed is determined and not necessarily the point where the shadows are supposed to fall, is 1.0 log units below the midpoint exposure. An average scene has a luminance range of 7 1/3 stops (log 2.20). Based on these conditions, the highlights will fall at a point approximately 0.92 log units above the midpoint exposure or mean log luminance. That leaves 0.92 - 2.20 = 1.28, 1.28 log units (`4 1/3) to fall below the mean log luminance as the shadow.
Notice the discrepancy between where the speed point is and where the shadows will fall? 1.0 log units for the speed point and 1.28 log units for the shadow or about a stop difference. Placing the speed point higher than the point where shadow falls automatically factors in a flare value when calculating speed because you are assuming flare will bring the shadows up to that point. For those paying close attention, you might have noticed that average flare is higher than a stop. That means that there is a slight safety factor incorporated into the mix. The actual placement of the shadows under average conditions will fall approximately 1/4 to 1/3 stop above the speed point. So, as you can see, the speed point isn't necessarily where the shadows are supposed to fall.
Given the above, the Zone System method meters the mid point exposure and then stops down four stops to find the speed point. That's 2/3 stop below the ISO speed point. ZS testing doesn't factor in flare and consequently, when flare is applied in shooting, the film will be over exposed by 2/3 stops in relation to the ISO speed. I've said this before, but ever wonder why most people who do ZS testing tend to come up with EIs 1/2 to 1 stop under the ISO speed rating? Not factoring in flare is why.
So how does it influence the scenes contrast. Flare brings the shadows up one stop but has little affect on the highlight, consequently a 7 1/3 stop average scene will have the appearance of a 6 stop scene at the back of the camera. Flare tends to add or subtract a 1/3 of a stop of flare to every stop of scene contrast. So, when I look at my film curve to see what the density range will be for a 2.20 log range, I don't look 2.20 logs from my speed point but 1.80 logs.
A way to determine the aim CI or slope for a given scene luminance range , take the scenes luminance range 2.2 and subtract the flare 0.40 making the effective scene luminance range 1.8 or 6 stops. As the slope equation is rise over run, you take the paper's log exposure range which can also be thought of as the desired negative density range as the value of the rise and divide that by the scenes luminance range minus flare which is the value for the run.
example:
1.05 / 2.2 - 0.40 = 0.58
without flare that would be
1.05 / 2.2 = 0.48
There's an graph the evaluates a number of different flare models and how they affect contrast determination back at post #79. The graph is from an article I've written on this very point of discussion (available in pdf form if you're interested).
One way to visually evaluate the relationship between flare and the film curve is to create a curve for the camera image. This camera image "quadrant" is placed next to the film curve. I have an example of this a few posts back (post #73). It has a flare and non flare curve and illustrates how flare affects shadow placement on the film curve.
I've found the greatest amount of information about a photographic system is through the use of a 4 quadrant reproduction curve. That's one that relates the camera image to the film curve to the paper curve and then compares the original subject to the print to form a reproduction curve. Without it, you're simply evaluating each part in a vacuum.
In my opinion, flare plays an important roll in photography and it's influence is frequently overlooked.
I hope this answers some of your questions.
Last edited by a moderator:
There's an graph the evaluates a number of different flare models and how they affect contrast determination back at post #79. The graph is from an article I've written on this very point of discussion (available in pdf form if you're interested).
Many thanks for some very interesting information Stephen. I have previously only read what Phil Davies writes about flare and its effect on photography, and I would love to study what you have written on the subject.
Claes
Well, first off, using a step wedge alone with 21 steps will just move a curve back and forth, but not show you which curve is proper. The MacBeth checker has simulated densities for skin of various tones and has one step scale which when cetered properly will give the correct densities to the simulated skin tones and other colors. Basically, the idea is to duplicate the MacBeth checker in terms of density, gradient and color.
As for using the step wedge or any wedge for flare or speed, remember that flare is a function of your position on the curve and that you may be looking at 3 different emulsions in a single film. In those emulsions, as Kriss has shown, the sharpness (or apparent sharpness) is a function of edge effects and the size of the object being photographed.
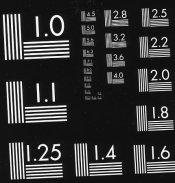
This means that micro and macro contrast are both important as is position on the curve when one is judging image quality. A step wedge will not show this, but a definition chart will.
In terms of evaluation, Kriss has given up to 30+ pages of math to show how to evaluate sharpness and exposure, while Bartelson has shown how the surroundings of the image when shot and then when viewed will alter perception of exposure, contrast and etc.
Zwick and DeMarsh have shown that viewing angle and distance are also important as is the surface of the print when evaluating the exact exposure of both the negative and the print in terms of contrast, sharpness, and apparent flare. In some cases, what appears to be flare is actually due to overexposure and image spread within the emulsion due to internal reflections. This field includes the science of goniophotometry which I have mentioned here before.
In addition, emulsions may swell around image sites or contract which further influence our interpretation of the emulsion sharpness and apparent flare. This may be shown by using a HQ developer compared to a Pyro developer. In addition, the contrast and sharpness vary as a function of the wavelength of the light used to print the print and this will influence our perception of the image. This is shown in the works of F. E. Ross, et al. and has been known since the 20s.
And so, the math may be one thing, in theory, but in practice what works is of the main importance.
A good set of photos of a MacBeth color checker and definition chart will reveal almost all you need to know about a given camera/film/process/print/process combinaton.
PE
As for using the step wedge or any wedge for flare or speed, remember that flare is a function of your position on the curve and that you may be looking at 3 different emulsions in a single film. In those emulsions, as Kriss has shown, the sharpness (or apparent sharpness) is a function of edge effects and the size of the object being photographed.
This means that micro and macro contrast are both important as is position on the curve when one is judging image quality. A step wedge will not show this, but a definition chart will.
In terms of evaluation, Kriss has given up to 30+ pages of math to show how to evaluate sharpness and exposure, while Bartelson has shown how the surroundings of the image when shot and then when viewed will alter perception of exposure, contrast and etc.
Zwick and DeMarsh have shown that viewing angle and distance are also important as is the surface of the print when evaluating the exact exposure of both the negative and the print in terms of contrast, sharpness, and apparent flare. In some cases, what appears to be flare is actually due to overexposure and image spread within the emulsion due to internal reflections. This field includes the science of goniophotometry which I have mentioned here before.
In addition, emulsions may swell around image sites or contract which further influence our interpretation of the emulsion sharpness and apparent flare. This may be shown by using a HQ developer compared to a Pyro developer. In addition, the contrast and sharpness vary as a function of the wavelength of the light used to print the print and this will influence our perception of the image. This is shown in the works of F. E. Ross, et al. and has been known since the 20s.
And so, the math may be one thing, in theory, but in practice what works is of the main importance.
A good set of photos of a MacBeth color checker and definition chart will reveal almost all you need to know about a given camera/film/process/print/process combinaton.
PE
P.E.
Very interesting, thanks.
Found another paper
Breneman, E.J., The Effect of Illuminance and Relative Surround Luminance on the Appearance of Black-and-White Photographs, Photographic Science and Engineering, Vol. 6, No. 3, May-June 1962.
Very interesting, thanks.
Found another paper
Breneman, E.J., The Effect of Illuminance and Relative Surround Luminance on the Appearance of Black-and-White Photographs, Photographic Science and Engineering, Vol. 6, No. 3, May-June 1962.
I found a paper by George Higgins titled "Image Quality" from the mid '80s. I don't have anything more than an SPSE conference refererence. It seems to relate to this discussion to some extent.
But, giving this more thought, here are some things to consider.
Lets say you have a 2 emulsion component film, the fast being a coarse grained 10 micron high iodide emulsion and the slow being a 1 micron low iodide emulsion. Now, the fast would have high edge effects, high turbidity and lots of internal reflections due to the big grains.
Expose a flare test in an 8x10 camera and both components would look the same in micro and macro image densitometry because at large format sizes macro and micro images approace identity, but in a 35mm camera, the low end of the scale would be altered in one direction by turbidity and in the other direction by micro contrast changes. Which wins? The finer grained emulsion in the mid scale and shoulder would look the same in both cases in all probability, but the coarse grained emulsion could go either way depending on film design parameters.
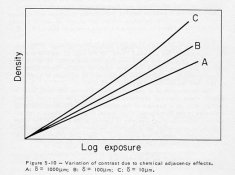
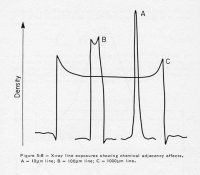
The first figure below is the hypothetical edge effects of the coarse grained high iodide emulsion and the second figure is the effects of these edge effects on micro vs macro contrast, the 1000 micron line being assumed to represent macro contrast. These are reproduced, with permission, from the article by Mike Kriss.
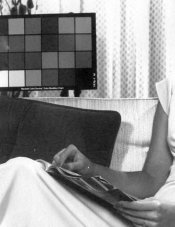
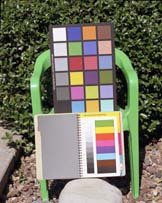
The last figure is a properly exposed print taken of a person with a MacBeth color checker with the neutral scale centered. By examining the reflection densities of the chart and determining their separation in Log E, one can then place the negative of the chart onto an H&D curve. One can also determine the speed by placing the exposure to give a dmin and dmax on the checker.
The fourth figure is a single color shot of the checker as reference taken on 120 Portra VC shot at 160. This can be used as the reference. I have done the same on Polaroid and a variety of other color and B&W films.
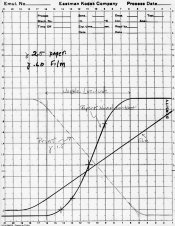
The next figure is a contact print of a definition chart onto Ilford MGIV paper which I shoot sometimes with the checker, and the final figure is a set of curves showing how a film, paper and print curve set can be shown together. In the final figure, I did not show any conversion curve from film through the paper to the print, and so the curves do not line up properly. Normally, this would be done on a 4 quadrant sheet of graph paper with a conversion curve that represents the slope of the silver density deviation from 1.0 due to the color or tone of the silver.
PE
But, giving this more thought, here are some things to consider.
Lets say you have a 2 emulsion component film, the fast being a coarse grained 10 micron high iodide emulsion and the slow being a 1 micron low iodide emulsion. Now, the fast would have high edge effects, high turbidity and lots of internal reflections due to the big grains.
Expose a flare test in an 8x10 camera and both components would look the same in micro and macro image densitometry because at large format sizes macro and micro images approace identity, but in a 35mm camera, the low end of the scale would be altered in one direction by turbidity and in the other direction by micro contrast changes. Which wins? The finer grained emulsion in the mid scale and shoulder would look the same in both cases in all probability, but the coarse grained emulsion could go either way depending on film design parameters.
The first figure below is the hypothetical edge effects of the coarse grained high iodide emulsion and the second figure is the effects of these edge effects on micro vs macro contrast, the 1000 micron line being assumed to represent macro contrast. These are reproduced, with permission, from the article by Mike Kriss.
The last figure is a properly exposed print taken of a person with a MacBeth color checker with the neutral scale centered. By examining the reflection densities of the chart and determining their separation in Log E, one can then place the negative of the chart onto an H&D curve. One can also determine the speed by placing the exposure to give a dmin and dmax on the checker.
The fourth figure is a single color shot of the checker as reference taken on 120 Portra VC shot at 160. This can be used as the reference. I have done the same on Polaroid and a variety of other color and B&W films.
The next figure is a contact print of a definition chart onto Ilford MGIV paper which I shoot sometimes with the checker, and the final figure is a set of curves showing how a film, paper and print curve set can be shown together. In the final figure, I did not show any conversion curve from film through the paper to the print, and so the curves do not line up properly. Normally, this would be done on a 4 quadrant sheet of graph paper with a conversion curve that represents the slope of the silver density deviation from 1.0 due to the color or tone of the silver.
PE
Attachments
| Photrio.com contains affiliate links to products. We may receive a commission for purchases made through these links. To read our full affiliate disclosure statement please click Here. |
PHOTRIO PARTNERS EQUALLY FUNDING OUR COMMUNITY:  |