Epson V700/V750 focus height...finding the sweet spot.

img421.jpg

H
img421.jpg

  • Tel
  • Apr 26, 2025
  • 1
  • 1
  • 22
Caution Post

A
Caution Post

  • 2
  • 0
  • 40
Hidden

A
Hidden

  • 1
  • 0
  • 39
Is Jabba In?

A
Is Jabba In?

  • 3
  • 0
  • 46
Dog Opposites

A
Dog Opposites

  • 2
  • 3
  • 151

Forum statistics

Threads
197,483
Messages
2,759,758
Members
99,514
Latest member
cukon
Recent bookmarks
0

gmikol

Subscriber
Joined
Mar 2, 2009
Messages
633
Location
Vancouver, W
Format
35mm
Very few flatbed film scanners out there have autofocus. This makes placing the film plane correctly at the focus plane a critical aspect of setting up a flatbed scanner. Epson has chosen to address this by using adjustable-height film holders, which allow a choice of 2.5mm, 3mm or 3.5 mm above the glass. The nominal focus point is 3mm above the glass.

In a previous thread, I measured the height of my film holders on the "+" setting (nominally 3.5mm above the scanner glass), and found them to be close, 3.38mm, on average (4 holders, 2x35mm and 2x120). I was satisfied with the uniformity of the results for the film holders, and felt that once I found an optimum height, I could set up all my film holders the same way.

This got me to wondering what the actual optimum focus point of the scanner is. Due to manufacturing tolerances, this can vary from scanner to scanner, and needs to be tested individually.

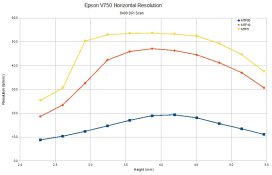
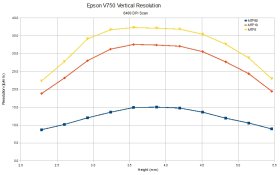
Here are the results, in graph form, which show that the actual sweet spot (MTF50 line) is quite narrow, and in the case of my scanner, approximately 3.8mm above the scanner glass, higher than the stock Epson holders allow.

Horizontal resolution (across the scanner bed)
811d1351624311-epson-v700-v750-focus-height-finding-sweet-spot-v750-horizontal-resolution-jpg


Vertical resolution (direction of scanner travel)
812d1351624311-epson-v700-v750-focus-height-finding-sweet-spot-v750-vertical-resolution-jpg


I'll provide a little more explanation in my next post.

--Greg
 

Attachments

  • V750 Horizontal Resolution.jpg
    V750 Horizontal Resolution.jpg
    82.7 KB · Views: 820
  • V750 Vertical Resolution.jpg
    V750 Vertical Resolution.jpg
    85.9 KB · Views: 933
OP
OP

gmikol

Subscriber
Joined
Mar 2, 2009
Messages
633
Location
Vancouver, W
Format
35mm
So what does all this mean?

First off, the graphs show resolution, in lp/mm, against height above the scanner glass (in mm), the higher the value the better, but the values of the 3 different lines must be looked at together. e.g. for the horizontal resolution graph, the MTF5 line shows a plateau from about 3.2 mm to about 4.5 mm, but the MTF50 line shows a much narrower peak. The sweet spot height is where all 3 lines are closest to their maximums.

Instead of using a test chart, like the USAF 1951 chart, and trusting my eyes to determine the best height, I used an analytical method called "Slanted-Edge MTF". In very brief terms, you scan a very straight edge that's slightly askew, either horizontally or vertically. In my case, I used a razor blade. Because the edge covers different amounts of a single pixel depending on where you are along the edge, it's like you've scanned it at 10x the sampling frequency, and the computer can do some math on the image to determine the Modulation Transfer Function (MTF) of the scanner. MTF is a measure of how much contrast (the modulation %) is preserved when going through the optical system at various spatial frequencies (lp/mm).

An ideal sampling system would have 100% modulation from 0 lp/mm up to the sampling limit of the system, and 0 beyond it. No system is ideal, there are aberrations in the lens, mis-alignments in the optical path, flare, diffraction, even intentional design design decisions like the layout of the sensors on the CCD or the quality of the lens that reduce the contrast transfer through the optical system. There are 3 lines in each graph, representing the resolution of the system at a certain threshold of contrast transfer. They are:

MTF50 -- 50% modulation. This is generally regarded as the "contrast resolution" of a system. It's a measure of how much local contrast is preserved in an image.

MTF10 -- 10% modulation. Based on international standards, this is the generally accepted value for useful resolution, this is sometimes referred to as "extinction resolution", but that's not entirely accurate, since the system is capable of capturing higher-frequency information than this, albeit at severly reduced contrast.

MTF5 -- 5% modulation. When looking at resolution test charts, like the USAF 1951 or others, I've found that a value of 5% modulation more closely matches what my eye perceives to be the last useful bit of resolution, so I've included this value as well.

In looking at the graphs, you can see why just using a test chart of bars (or even an image) might be deceptive. We'll tend to look for the rendition of the absolute finest detail we can, as an indicator of resolution, this is equivalent to just looking at the MTF10 or MTF5 data. By looking at that data, we might feel that there is minimal difference across various heights, as the large plateau on the MTF5 graphs show. So it is possible to choose a film height which maximizes MTF5 resolution, but is still sub-par for contrast resolution. It is much harder for us to judge the 50% modulation point by eye, which is why an MTF calculation is beneficial. The graphs show that the true sweet spot is quite narrow.

Lastly, I'll note that this type of testing is not expensive. There are commercial software packages out there that do this sort of calculation, but I used free image analysis software from the US National Institutes of Health called ImageJ, with the Slanted-Edge MTF plugin. It's not super user-friendly, but it works. There are also some Matlab programs out there to do the same thing, if you know how to use Matlab, and I would guess that Octave (open-source Matlab clone) might be able to run them as well. As for the hardware? Well, a scanner of course...a double-edge razor blade, a bit of plastic, some very small nuts & bolts from the hardware store, and a can of black spray paint was all it took.

Hope somebody out there finds this useful.

--Greg
 
OP
OP

gmikol

Subscriber
Joined
Mar 2, 2009
Messages
633
Location
Vancouver, W
Format
35mm
Here's a picture of the test jig.

--Greg
 

Attachments

  • IMG_1024_sm.JPG
    IMG_1024_sm.JPG
    167.9 KB · Views: 1,080

Pioneer

Member
Joined
May 29, 2010
Messages
3,866
Location
Elko, Nevada
Format
Multi Format
I am very interested but I have never done this and am a bit confused regarding the process. You scan the test jig at various locations and then use the software to assess the scan? Are there any website directions to explain the process a little more completely? Thanks for the work and the post btw.
 
OP
OP

gmikol

Subscriber
Joined
Mar 2, 2009
Messages
633
Location
Vancouver, W
Format
35mm
There's no software that I'm aware of that does all the steps automatically. And no website that I'm aware of. I put this together from a bunch of different places. Here's a little more detail on my workflow:

1) With the jig at its lowest setting, scan both areas (for horizontal and vertical) at maximum resolution (6400 DPI) and save. I saved the horizontal and vertical scans separately, with exact cropping done in Vuescan. This makes it easier for analyzing with ImageJ.

2) Turn all 4 screws 1/2 turn to elevate the holder. Scan again.

3) Repeat Step 2 until you've covered the range of interest. For me that was 11 half-turns (5.5 full turns) of a 4-40 thread (0.025" per full turn). This is 0.138 inches, or just over 3 mm. Since my jig starts out at ~2.3mm, that made the final height 5.5 mm.

4) I ran the Slanted-Edge MTF plugin in ImageJ on each image, and copied the table of results from the graph into a spreadsheet. Separate sheets for horizontal and vertical.

5) At this point, you could probably just graph all the results together, and pick the line that is farthest to the right. Instead, I chose to find the exact MTF50, 10, and 5 points by interpolating the data, and graphed those. That helped me see how big (or small) the sweet spot for focus was, and I had a need for that data for something else.

It helps to play around with ImageJ and the MTF plugin to get a feel for how they work. You can start by just laying down a razor blade on the scanner glass, or across the 35mm holder, maybe. I'm not sure exactly how long those blades are. The key is to have it at just a slight angle. The international standard for this is 5.74 degrees (a 1-in-10 angle). But anything between about 3 degrees and as much as 10 degree will probably yield good results.

Also, I built a separate jig, but there's no reason you couldn't just shim all the feet of a stock negative holder. My concern with doing it that way was whether all the shims would lie flat enough to be accurate, once you started stacking shims.

I have reply notifications turned on for this thread, so I'll be happy to answer any other questions people might have.

--Greg
 

Pioneer

Member
Joined
May 29, 2010
Messages
3,866
Location
Elko, Nevada
Format
Multi Format
Thanks Greg. I am going to put a jig together and give this a try over the upcoming weekend. I am sure I will run into a ton of questions.
 
OP
OP

gmikol

Subscriber
Joined
Mar 2, 2009
Messages
633
Location
Vancouver, W
Format
35mm
Best of luck. I'll try to help any way I can.

Keep these things in mind that if you're building a separate jig:
-- Make sure the razor blade is where the film would be, or make sure to compensate for 1/2 the thickness of the blade when calculating your shims
-- Make sure you measure the height of your film holder so you know how much to shim by.

This method would work great with a betterscanning holder...you've already got the screw height adjustment.

--Greg
 

Pioneer

Member
Joined
May 29, 2010
Messages
3,866
Location
Elko, Nevada
Format
Multi Format
I do have the adjustable better scanning holder so I will use that. Thanks
 

alanrockwood

Member
Joined
Oct 11, 2006
Messages
2,184
Format
Multi Format
Old thread, but I thought I would add to it. A few days ago I did some tests of optimal image height. I used the slant edge method analyzed using imagej and the slant edge plugin. I used a piece of a single edge razor blade to provide the edge, and I varied the height of the straight edge above the glass by using stacks of coins. I super-glued the coin stacks together. I did two scans for each coin stack. I rotated the coin stacks by 180 degrees between the two scans in order to compensate for any non-parallelness of the top of the coin stacks.

I used imagej on each image and extracted the line spread function. I fitted a bell shaped curve to each line spread function to make the analysis easier. I tried two different bell curve functions, and they gave basically the same end result. I took the peak width parameter from the bell shaped curve fits and then fitted that data as a function of height above the glass. Here is an example of the result. I figure that the best height is 3.6mm (rounded off to 0.1 mm), but 3.5mm is close enough, which is the highest spacer supplied with the Epson film holders.

Also, based on the results from the mtf curve, I figure that at optimum height the scanner should be capable of a resolution of about 2800, which is a slightly higher figure than most people have been quoting, but I assume that most people have not done the measurements at optimal film height above the glass.
plot3.jpg
 

Nodda Duma

Subscriber
Joined
Jan 22, 2013
Messages
2,686
Location
Batesville, Arkansas
Format
Multi Format
Nice! Since you can do a slant edge test, you should be able to extract the MTF which will give you contrast vs spatial frequency (resolution). That is, what you would expect the best contrast at 2800 dpi to be.
 

alanrockwood

Member
Joined
Oct 11, 2006
Messages
2,184
Format
Multi Format
Nice! Since you can do a slant edge test, you should be able to extract the MTF which will give you contrast vs spatial frequency (resolution). That is, what you would expect the best contrast at 2800 dpi to be.
I read somewhere that if you select a spot on the mtf curve that is about 2% to 5% of the maximum of the curve then that could give a good estimate for the resolution. The spot on the horizontal scale that corresponds to full resolution (6400 dpi) is 0.5. The spot on the curve where the mtf was about 0.035 was at a horizontal position of 0.2183. dividing that by 0.5 and multiplying by 6400 gives approximately 2800. I am not sure how valid this calculation is.

Here is what the mtf curve looks like that imagej generated with the slant edge plug in.

mtf curve.jpg
 

alanrockwood

Member
Joined
Oct 11, 2006
Messages
2,184
Format
Multi Format
By the way, I tried to post an image of an example of a slant edge image that I used, but I got error messages about the image being too big, even though I used rather extreme compression ratios when I converted the figure to jpeg.
 
Joined
Dec 10, 2009
Messages
6,303
Format
Multi Format
My negs weren't all that sharp using the film holders that came with my V-700. I had to get a Better Scanning film holders to improve the sharpness. After some trial and error, I figured out that a dime's height under the black plastic tab did the trick. I set one dime under each tab then adjusted the plastic screws to set the height.
 

Attachments

  • IMG_5027.JPG
    IMG_5027.JPG
    251.5 KB · Views: 500

shutterfinger

Member
Joined
Feb 25, 2013
Messages
5,033
Location
San Jose, Ca.
Format
4x5 Format
By the way, I tried to post an image of an example of a slant edge image that I used, but I got error messages about the image being too big, even though I used rather extreme compression ratios when I converted the figure to jpeg.
I've run into this difficulty many times. I keep reducing the image size in PS until it will fit or Save for web and Devices will work without file too large notices. I then adjust for a 100KB to 200KB file size.
The MTF curve in post 11 is 3000 x 2317 at 72 dpi. A higher dpi image will require fewer pixels in each dimension to fit. A 96 dpi at 6 to 8 inches in the long dimension print size displays well.
 

alanrockwood

Member
Joined
Oct 11, 2006
Messages
2,184
Format
Multi Format
I have done some more work. This time I did a more careful job of it, spending many hours in the project so far, and there are still some things to do to get some additional data. However, I thought I would post some results, in case anyone is interested. The goal for this experiment was to find the optimal height above the scanner glass. I haven't tried to extract actual resolution numbers out of this data.

Scanner: Epson V750

MTF measurement method: slant edge using imagej. I used the output curve that is in the form of a peak, and I fitted a Gaussian curve to these peaks. A Gaussian isn't the perfect functional form, but since I am only looking for relative peak widths at this time, I can live with imperfect fits, as long as the peaks being fitted are all of very nearly the same shape, which did seem to be the case.

Resolution targets: The cutting edges of single edge razor blades. These were superglued to a set of blocks to provide several heights. The heights above the base of each target was measured by a caliber, and included a correction for 1/2 of the blade thickness to account for the taper on the edge of the blade. The blades were blackened with a sharpie pen, which was not a perfect solution, but probably good enough at this point.

I measured the relative peak widths for five different heights above the glass. I did the measurement at five points on the glass. Each measurement was performed in triplicate and the results were averaged.

Here is what two of the curves look like.
graph on center 2.jpg
graph off center.jpg
For on-center imaging the optimal height was 3.74mm. This is pretty close to the value I got before (3.62mm), but I believe the present result is more reliable.

The off-center image was obtained 4cm off the centerline of the scan (i.e. the direction perpendicular to the direction of movement of the scanner head.) It was 8cm from the center point of the glass in the direction of the scanner movement. Interestingly, the optimal height for the off-center point is about 0.2mm higher than the optimal height for the center point.

Note that the peak width parameter should be considered as a relative number. Also, the peak width parameter is inversely proportional to the resolution, so small numbers are better than big numbers.

Also note that, like gmikol's results, the optimal height on this scanner specimen is higher than can be accommodated with the Epson-supplied adjustment tabs. Also note that from the graphs it is pretty clear that the 0.5mm adjustment steps supplied by Epson are not sufficient to adjust the scanner to optimal focus, unless you get lucky with your particular specimen of scanner. I guess this provided a good opportunity for Better Scanning to sell better film holders.

I will post more information as I get it figured out.
 
Last edited:

alanrockwood

Member
Joined
Oct 11, 2006
Messages
2,184
Format
Multi Format
Following up on my last post, Here's the data summary for the five points I measured:


x y best height (raw data)
-4 5 4.045
-4 -7 3.93
4 -7 3.93
4 5 4.085
0 0 3.74

Where "x" is the left/right coordinate relative to the center of the glass and "y" is the forward/back coordinate relative the center of the glass, with positive being in the direction toward the hinge in the back. Distances x and y are measured in centimeters and the best height is measured in mm.

From this I derived an equation which fits this data quite well:

best height = 3.74 + 0.0113*y + 0.0168*x*x

The maximum error relative to the five raw data points is +/- 0.02mm at two of the points. Here are the results using the equation:

x y best height (from equation)
-4 5 4.065
-4 -7 3.93
4 -7 3.93
4 5 4.065
0 0 3.74


This result is for my V750 scanner an might not work for other scanners of the same type. The most likely parameter to vary between scanners is the 3.74mm. It is probably set mainly by mechanical tolerances in setting the glass height. The second most likely is probably the 0.0113, which is probably determined mainly by how level the scanner track is with the glass. The least likely to vary by much is the 0.0168, which is probably set mainly by the design of the scanner lens.

I apologize for the format of the tables in this post. I tried to format them when I made the post, but the system stripped out the spacings that would have made the tables look nicer.
 

MattKing

Moderator
Moderator
Joined
Apr 24, 2005
Messages
51,945
Location
Delta, BC Canada
Format
Medium Format
I apologize for the format of the tables in this post. I tried to format them when I made the post, but the system stripped out the spacings that would have made the tables look nicer.
There is an "Add Table" function above the posting area - 4 from the right.
 

Nodda Duma

Subscriber
Joined
Jan 22, 2013
Messages
2,686
Location
Batesville, Arkansas
Format
Multi Format
Very nice work.

The 0,0 datapoint is the only point along the centerlines that you measured MTF. I’d recommend measuring a couple more points along the center lines (i.e. x=0 and y=0) to see if that value is consistent or just an outlier. A 1/4mm difference in best focus is significant in optical distances so it’d be interesting to know what’s causing that. Also suggest measuring halfway to the edges to verify the polynomial, but that’s understandably a lot of work.

I’ll add similar measurements to my to do list for my V750, which will be helpful to start seeing what kind of tolerances the scanner was built to.

Also be curious to see what the actual MTF curve at best focus looks like.
 
Last edited:

alanrockwood

Member
Joined
Oct 11, 2006
Messages
2,184
Format
Multi Format
Since everyone must be waiting with bated breath for the next results, I will present my latest results. I probably won't do any more measurements.

First I more carefully measured the heights of my slanted edge targets. They turned out to be 3.06, 3.30, 3.72, 4.00, and 4.41 mm. Then I picked nine points on the scanner glass, measuring the coordinates relative to the center of the glass. I picked all combinations of x=-5, 0, +5 and y=-8, 0, +8, measured in cm. This covered most, though not quite all of the usable glass area for transparency scans. I used all five targets at each of the nine points on the glass

Making judicious use of curve fitting, I determined the optimum height above the glass for the best focus at each of the points. I then fitted the data using several trial functions. The most general equation was z=a + b*x + c*y + d*x^2 + e*y^2. However, I found that the a simpler equation z=a+d*x^2 provided a fit that was, for practical purposes, as good as the more general equation. The fits to the simpler equation gave a=3.7201 and d=0.0063. The RMS of the residuals for fit using the simpler equation was 0.039mm, which is almost better than one might have a right to expect. The RMS of the residuals gives a global measure of how much deviation there is between the fitted equation and the experimentally determined height above glass. This gave a sweet spot down the centerline of the glass of 3.73mm above glass, and to the right and left sides it was 3.89mm above glass.

Unless one had some fancy film holders that could allow very fine adjustment for heights at each of the different points on the glass, one might as well just pick a single number to use for the height above glass for every point. 3.80 mm was that number (rounded to 3.8 for simplicity), and the RMS residuals for that pick was 0.09 mm, or in other words the RMS average focus error would be about 0.1 mm when taken over most of the area of the glass.

Each individual scanner will produce a different optimum focus height above glass. However, basing a procedure on the short description I gave here it should be possible for anyone to determine the optimum focus on their scanner to a very good level of accuracy.

I am still debating with myself to show some mtf curves.
 

bernard_L

Member
Joined
Feb 17, 2008
Messages
1,959
Format
Multi Format
Really nice work!
Some comments that are meant to be constructive.
  1. The optimum height, in practice, should come with (a) an error bar (the estimated error of the determination) and (b) a tolerance (how much one can deviate before it matters); ideally, the former should be less than the latter, which seems to be the case in your careful work.
    Could we say that a practical height tolerance is what corresponds to a 10% loss of lp/mm at 50% contrast? Of course, each one is free to set a different limit.
  2. The lp/mm curves in the first post are IMO more informative than the peak width curves shown after. Although I would guess that the lp/mm scales as the inverse of the peak width.
  3. I did similar experiments with slanted-edge MTF, and rather than use a razor blade with a height correction, I used one of these thin metallized labels (with a unique number) that the labs stick on the leader of your film: that one is directly in the plane of the film, in the actual film holder, avoiding the transfer of height values from a separate jig, with concomitant error-bar build-up.
  4. I am doubtful of the relevance of a lp/mm figure at 10% contrast: sure, you can still count the line pairs, but for a real-world image, contrast has dropped to 10% of its low-frequency value. I'd rather use the 50% value, even if it sounds less gratifying.
The drop in the MTF invites to perform MTF restoration. How to avoid going over the top? And do it in an objective way. I did some experiments in that direction (also using slanted-edge MTF) and might post results as soon as I can dig up the results or (probably more efficient) re-do the experiments with proper note-taking.
 

Nodda Duma

Subscriber
Joined
Jan 22, 2013
Messages
2,686
Location
Batesville, Arkansas
Format
Multi Format
Great job! From my design experience, the 0.1mm variance is very likely well within the depth of focus of the scanner lens. So a flat piece of film will be scanned as good as it possibly can at that 3.8mm height.

Focus problems will then only stem from the film not laying flat in the holder. That is, scanning a curled or cupped strip of 35mm or 120 film.
 
Last edited:

Alan Johnson

Subscriber
Joined
Nov 16, 2004
Messages
3,221
I read somewhere that if you select a spot on the mtf curve that is about 2% to 5% of the maximum of the curve then that could give a good estimate for the resolution. The spot on the horizontal scale that corresponds to full resolution (6400 dpi) is 0.5. The spot on the curve where the mtf was about 0.035 was at a horizontal position of 0.2183. dividing that by 0.5 and multiplying by 6400 gives approximately 2800. I am not sure how valid this calculation is.

Here is what the mtf curve looks like that imagej generated with the slant edge plug in.

View attachment 214348
Your resolution results are more or less the same as those obtained by Sandy King and by me, except we probably used a higher contrast to read off the resolution:
https://www.photrio.com/forum/threads/resolution-of-the-epson-v700.150649/
The professionals, who test a lot of scanners, obtained a similar figure:
https://www.filmscanner.info/en/EpsonPerfectionV800Photo.html
 

PENTACLE

Member
Joined
Aug 2, 2022
Messages
1
Location
Czech
Format
8x10 Format
Good day,

I tried to measure the focus height of the EPSON V850 scanner using a razor blade tilted at an angle of 5 degrees. I scanned the razor blade vertically and horizontally. I evaluated everything using the Slanted Edge MTF app. For the measurement, I used the largest value from the LSF chart. I need advice on why the focus height is different when scanning the razor vertically and horizontally. When scanning horizontally, the focus height is 3.1 mm and vertically 2.3 mm. Am I doing something wrong? Please advise.
 

alanrockwood

Member
Joined
Oct 11, 2006
Messages
2,184
Format
Multi Format
Good day,

I tried to measure the focus height of the EPSON V850 scanner using a razor blade tilted at an angle of 5 degrees. I scanned the razor blade vertically and horizontally. I evaluated everything using the Slanted Edge MTF app. For the measurement, I used the largest value from the LSF chart. I need advice on why the focus height is different when scanning the razor vertically and horizontally. When scanning horizontally, the focus height is 3.1 mm and vertically 2.3 mm. Am I doing something wrong? Please advise.

Good question. Unfortunately, I don't have a good answer. Maybe someone else might.
 
Photrio.com contains affiliate links to products. We may receive a commission for purchases made through these links.
To read our full affiliate disclosure statement please click Here.

PHOTRIO PARTNERS EQUALLY FUNDING OUR COMMUNITY:


Ilford ADOX Freestyle Photographic Stearman Press Weldon Color Lab Blue Moon Camera & Machine
Top Bottom