Color Bias in characteristic curve in negative films

$12.66

A
$12.66

  • 6
  • 3
  • 117
A street portrait

A
A street portrait

  • 1
  • 0
  • 148
A street portrait

A
A street portrait

  • 2
  • 2
  • 142
img746.jpg

img746.jpg

  • 6
  • 0
  • 111
No Hall

No Hall

  • 1
  • 8
  • 159

Recent Classifieds

Forum statistics

Threads
198,800
Messages
2,781,062
Members
99,708
Latest member
sdharris
Recent bookmarks
1

Ted Baker

Member
Joined
Sep 18, 2017
Messages
236
Location
London
Format
Medium Format
Background, I am trying to create some scanning software for negative inversion.

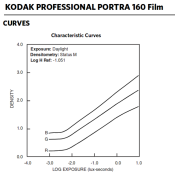
I am interested to hear from anyone involved in the design of color negative emulsions, or similar technical background, that could explain what the reason is for the different contrast index or gamma between each color layer, of a color negative emulsion?

Tracing the physical process through to exposure onto color paper, it is clear to me at least that this bias is not removed by the corresponding individual characteristic curves of color RA-4 paper.
 

Photo Engineer

Subscriber
Joined
Apr 19, 2005
Messages
29,018
Location
Rochester, NY
Format
Multi Format
The gamma of a magenta (green) curve is different in a single color exposure than in a neutral due to interimage effects which are there to correct for unwanted absorption in the dyes. This is therefore translated into a paper print as a corrected color image with true colors. An expanded explanation would take a textbook to write, but there is some information out there, just not very much in the private domain.

PE
 

markbarendt

Member
Joined
May 18, 2008
Messages
9,422
Location
Beaverton, OR
Format
Multi Format
Just a thought Ted, it seems to me that your task is to replace what the paper does, not what the film does. The papers curves, etcetera, is your real world model for design.
 
OP
OP

Ted Baker

Member
Joined
Sep 18, 2017
Messages
236
Location
London
Format
Medium Format
it seems to me that your task is to replace what the paper does, not what the film does

Very possible :smile: but I am trying to get a better picture of what really goes on for a number of reasons. There isn't really much that I have found in the public domain, in the glory days of film, I could see how it made sense for Kodak et all to keep it proprietary, but not so in the digital age.
The gamma of a magenta (green) curve
Don't you mean Yellow (Blue) curve?

which are there to correct for unwanted absorption in the dyes.

Is this unwanted absorption in the paper? or if it is the negative then how do the prepare the film before doing density measurements?

Thanks PE for you help!

I had thought it has something to do with Bezold-Brucke effect or some such effect, but it's not obvious.
 
Last edited:

RPC

Member
Joined
Sep 7, 2006
Messages
1,628
Format
Multi Format
OP, there has been discussions on these matters (many involving PE) right here on this site, in this forum. All you have to do is look through the color archives and you can learn a lot, much of what is hard to find elsewhere. I'm not saying you can't ask questions here now, but consider the archives too.
 

Photo Engineer

Subscriber
Joined
Apr 19, 2005
Messages
29,018
Location
Rochester, NY
Format
Multi Format
Ted, I used green as an example. Sorry that was not clear. It is actually true of all 3 layers. The single color exposures are higher in contrast than the neutral. As you flash a green single color with blue and red, the green contrast goes down as the blue and red flash goes up.

PE
 
OP
OP

Ted Baker

Member
Joined
Sep 18, 2017
Messages
236
Location
London
Format
Medium Format
OP, there has been discussions on these matters (many involving PE) right here on this site, in this forum. All you have to do is look through the color archives and you can learn a lot, much of what is hard to find elsewhere. I'm not saying you can't ask questions here now, but consider the archives too.

I was hoping for more than a discussion, I was hoping for an answer :smile:

PE I am still trying to digest what you meant by

correct for unwanted absorption in the dyes

In particular I am trying to understand why the bias is a ^power function as opposed to a straight coefficient
 

Mr Bill

Member
Joined
Aug 22, 2006
Messages
1,481
Format
Multi Format
Just a thought Ted, it seems to me that your task is to replace what the paper does, not what the film does. The papers curves, etcetera, is your real world model for design.

Historically, this has been the important part, but it was what the paper does AS SEEN BY THE EYE under given lighting conditions.

An important part of this is, how does the paper "see" the film, raising the question (to Ted), where are you getting your info about the contrast of the film? If you are using characteristic curves, these are mostly made with a certain densitometer response (status M, I think, for color neg). These use a narrow spectral response, and almost certainly are not how a paper "sees" them - the results are usually broadly similar, but nothing like exact.

Nowadays, with scanning, and perhaps no printing, it's probably better to bypass the print aspect, and to try to interpret the color negative directly compared to what's in the original scene. I've never dealt with doing this directly with film, but have done so with digital cameras - the film adds another layer of complexity.

A general rule of thumb is that it is possible, working with "color spaces," to convert anything to anything else, by getting the data into a linear space, then multiply with a 3x3 matrix (getting the correct matrix is the tricky part, and is beyond me). The matrix allows all three "colors" to interact with each other in the calculations. With the scanners I have been (only slightly) involved with in a large lab operation, Kodak always supplied the proper matrices based on the known scanner respone (they were Kodak scanners) and the specific film (Kodak professional color neg films).

Ted, roughly how much knowledge do you have in this general area?
 
OP
OP

Ted Baker

Member
Joined
Sep 18, 2017
Messages
236
Location
London
Format
Medium Format
where are you getting your info about the contrast of the film?

from the characteristic curve published in the tech sheet

these are mostly made with a certain densitometer response (status M, I think, for color neg).

No I did not know that, but I had inferred it was something like that, however I also inferred that the measurements are taken using a complete piece of film i.e. all layers of the emulsion, which have been exposed to "daylight". I am now wondering if that assumption is correct?

Ted, roughly how much knowledge do you have in this general area?

When I started roughly nil :smile: Though I have a fair amount of practical photographic experience and basic programming skills. Since then I invested a fair amount of time on the topic and put together a working prototype. I put a post up earlier requesting scans from others to see if I could move it forward. The knowledge definitely exists somewhere, I am certain someone at Kodak for example understands it very well... Once the problem and solution is clearly defined it can be put into software, It already is of of course in existing proprietary solutions.
 
Last edited:

Mr Bill

Member
Joined
Aug 22, 2006
Messages
1,481
Format
Multi Format
however I also inferred that the measurements are taken using a complete piece of film i.e. all layers of the emulsion, which have been exposed to "daylight". I am now wondering if that assumption is correct?

Yes, that is correct. The problem is that spectrally, in the general range from about 400 to 700 nm, roughly what the human eye sees, the spectral dye curves wiggle around a lot. Since the densitometer measures only a narrow spectral zone (I don't have any specs at hand) you can see that it could get different measurements depending on if it were at a peak or valley of the dye absorption. Now with photo paper or the human eye, the spectral sensitivities are much broader, so not that much affected by the wiggle in the curves.

What I'm trying to imply is that a certain contrast that a densitometer measures is not necessarily exactly the same as the paper would see.

A second implication is that two different scanners, depending on the spectral ranges they see, could give significantly different scan results for the same original scene color. So the software ideally corrects for this too.
 

Photo Engineer

Subscriber
Joined
Apr 19, 2005
Messages
29,018
Location
Rochester, NY
Format
Multi Format
There is both Integral and Analytical Status M densitometry. Integral is what is read directly from the strip of film or seen by the eye. Analytical is a measure of how much of each dye is really present, without the added densities of the other dyes. Thus, when you see spectral curves of the dyes in film, you see that they overlap. Integral reads all of the dyes plus overlap, but analytical reads only the dye, no overlap.

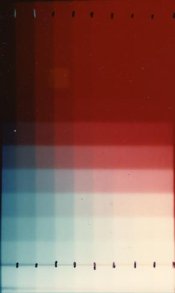
We read both multilayers and single color coatings, of which the latter may contain several layers itself. The multilayers give the best data, and in that case we read stepped and flashed exposures reading each density and comparing integral (the eye) and analytical (what is happening) and we do it with film and then print those exposures onto paper and read them. These are called single undercut or double undercut depending on the exposure.

There is a sample here of a double undercut print exposure of stepped cyan vs stepped red. The goal is to have a flat response of blue density in a yellow when cyan or magenta dye is increased. To do this in a cyan, you must create a positive image in magenta and yellow dye everywhere there is a negative image of cyan. This is done using DIR couplers and colored couplers. The DIR inhibits adjacent layers and the colored coupler creates the positive image while also creating a negative image.

This is part one of about 1 million such posts as we move forward in color film building. :wink:

PE
 

Attachments

  • undercut1.jpg
    undercut1.jpg
    18.8 KB · Views: 182
OP
OP

Ted Baker

Member
Joined
Sep 18, 2017
Messages
236
Location
London
Format
Medium Format
There is both Integral and Analytical Status M densitometry. Integral is what is read directly from the strip of film or seen by the eye. Analytical is a measure of how much of each dye is really present, without the added densities of the other dyes. Thus, when you see spectral curves of the dyes in film, you see that they overlap. Integral reads all of the dyes plus overlap, but analytical reads only the dye, no overlap.

PE, I inferred something similar on my own as one of the possibilities, regarding about what you meant earlier in your comment that said:

effects which are there to correct for unwanted absorption in the dyes

Trying to put it all together, Does the published characteristic curve use and analytical measure or an integral measure?
Or even if it is an integral measure does the bias exist because the measurement are narrow spectrally, and if the measurements were wide enough spectrally to take fully into account the overlap in the dyes the bias would disappear? This would also explain why bias is a power function not a simple co-efficient.

Am on the right track or just talking gibberish? :smile: Looking carefully at the spectral curve for Porta 160 this does indeed make some sense.

Screenshot from 2017-11-10 21-22-34.png Screenshot from 2017-11-29 02-12-07.png
meZOSm
 
Last edited:

Photo Engineer

Subscriber
Joined
Apr 19, 2005
Messages
29,018
Location
Rochester, NY
Format
Multi Format
If you include spectral sensitivity as above, it is gibberish! Spectral curves have nothing to do with dye curves produced during development. You need them to work from. They will be somewhat similar but will lead you to no conclusion that works.

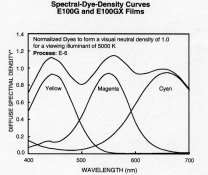
OTOMH, all I could locate this late were these Ektachrome dye curves which shows the individual dyes and the unit neutral, which is the amount of each dye to form a gray or black image to the human eye.

PE
 

Attachments

  • Ektachrome dye curves.jpg
    Ektachrome dye curves.jpg
    92.2 KB · Views: 238
OP
OP

Ted Baker

Member
Joined
Sep 18, 2017
Messages
236
Location
London
Format
Medium Format
If you include spectral sensitivity as above, it is gibberish!

But not totally ? :happy: When I wrote it, I could see how it could turn out a number of different ways, as I don't have all the pieces of the puzzle.
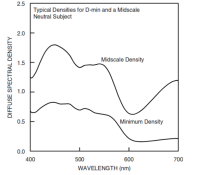
Interestingly the dye curve published for portra 160 does not have the individual dyes like the ektachrome one you posted has.

Screenshot from 2017-11-29 09-39-59.png

Where could I find information on how these tests are actually carried out?

I will take some time to digest what is here and see if I can put it together a coherent statement, on what the reason for the bias is. The penny is yet to drop, but maybe I am closer.
 
Last edited:

Anon Ymous

Member
Joined
Feb 7, 2008
Messages
3,661
Location
Greece
Format
35mm
Ted, are you sure that what you're trying to make makes sense? In theory, it seems to do, but reality is more complicated IMHO. It seems to me that you underestimate the effect development does. There's probably much variation caused by different formulations, underreplenished chemicals, unreplenished and reused chemicals and whatnot. Regardless of that, paper A differs from paper B, so what exactly is the "right" result? It's negative film, it is open to interpretation I guess. And we haven't even touched the technicalities and pitfalls that scanning involves.
 
OP
OP

Ted Baker

Member
Joined
Sep 18, 2017
Messages
236
Location
London
Format
Medium Format
Ted, are you sure that what you're trying to make makes sense?

Am I sure that I will be successful? no. :smile: However the problem has already been solved, IT IS already very well "understood", at least in terms of existing software solutions, so It can be done!
 
Last edited:
Joined
Apr 2, 2017
Messages
639
Format
Multi Format
Ted, I think your goal seems to address a gap in the market for small/individual professionals and advanced amateurs or hobbyists. Do you think the technology behind the Fuji Frontier 350/370 equipment (analog film input to digital paper print) is similar to the technology you are striving for?

Maybe some of the technology/philosophy/algorithms there are applicable.
 

Photo Engineer

Subscriber
Joined
Apr 19, 2005
Messages
29,018
Location
Rochester, NY
Format
Multi Format
But not totally ? :happy: When I wrote it, I could see how it could turn out a number of different ways, as I don't have all the pieces of the puzzle.

Interestingly the dye curve published for portra 160 does not have the individual dyes like the ektachrome one you posted has.

View attachment 190965

Where could I find information on how these tests are actually carried out?

I will take some time to digest what is here and see if I can put it together a coherent statement, on what the reason for the bias is. The penny is yet to drop, but maybe I am closer.

Ted, this set of curves is correct but leaves out individual dyes because of the masking. It is also why the curves drop in Dmax from 400 to 600 nm. That is the orange mask.

What tests? We do flashed and step interimage as I showed above and read them with a densitometer. That's it. The actual data is reduced to readable images directly for integral and via matrix algebra for analytical.

PE
 
OP
OP

Ted Baker

Member
Joined
Sep 18, 2017
Messages
236
Location
London
Format
Medium Format
What tests?

Possibly all three, but I think the details of how the characteristic curve are created is important:

i.e. is it an integral measurement? I am now guessing it is, which would account for the bias in the gamma

Basically I yet to form a clear picture of why the bias exists in the negative, and why it does not seem to exist in the paper. Though I am guessing that it is because the dyes in the paper are more saturated, and thus do not interfere with each other in the same ways the dyes in the film do.
 

Sirius Glass

Subscriber
Joined
Jan 18, 2007
Messages
50,364
Location
Southern California
Format
Multi Format
The bias is used to compensate for some color deficiencies by over compensating and then during printing not taking all of the over compensating out.
 

Photo Engineer

Subscriber
Joined
Apr 19, 2005
Messages
29,018
Location
Rochester, NY
Format
Multi Format
Ted, a curve is created by means of a sensitometer. This exposes film to simulated daylight or tungsten light and creates a 21 step scale with 0.15 LogE increments. The film is then balanced to create a neutral to the desired light source. At the same time the interimage exposures are made to insure proper print quality using the method Sirius Glass described above. Everything is choreographed such that the film and the print give a neutral and colors which are reproduced as close to the original as possible. To do this we use a spectrometer which measures transmission or reflection density at wavelengths from 400 to 700 nm. This is what creates the curves you posted for negative color film.

We often use Munsell charts to verify different colors and we use special CIE graphs to check our colors.

PE
 
OP
OP

Ted Baker

Member
Joined
Sep 18, 2017
Messages
236
Location
London
Format
Medium Format
PE, thanks for your help, however I think now my question has gotten a little lost, with no clear demonstrable answer.

It may help if take a step back and prepare simple transform of simulated daylight exposures of a white card, tracing it through the intensities of the original scene, through to the density on the negative, through to the final densities on the paper. It is not yet clear to me from looking at the graphs where the bias disappears.
 

alanrockwood

Member
Joined
Oct 11, 2006
Messages
2,185
Format
Multi Format
I wonder if a spectrometer might be useful to help characterize films. Something I learned a few days ago is that one can use a compact disc as a grating to separate light into a spectrum. From this knowledge one can build a spectrometer. There are several pages on the internet that discuss this.
 
Photrio.com contains affiliate links to products. We may receive a commission for purchases made through these links.
To read our full affiliate disclosure statement please click Here.

PHOTRIO PARTNERS EQUALLY FUNDING OUR COMMUNITY:


Ilford ADOX Freestyle Photographic Stearman Press Weldon Color Lab Blue Moon Camera & Machine
Top Bottom