Ethan Brossard
Member
Here's a short video about an exposure unit I just finished building.
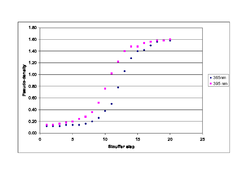
In my college's alt process darkroom, I noticed that when I printed an x-ray negative developed in pyrocat in a traditional fluorescent black light bulb exposure unit, I got significantly lower contrast than I got when I printed it in our Cone Editions VerifiedUV LED exposure unit. This is because pyro negatives have increased density in UV light, and the density gets greater the deeper the UV light gets. I think the BLB box uses blue/black bulbs likely dominant around 395nm. The cone edtions box on the other hand uses 365nm LEDs, and with the 365nm light, I got about 2 stops more contrast. With that in mind, I designed this box to use both 365nm and 395nm LEDs, which can be dimmed by PWM separately. By dimming the 365m I get lower contrast, and comparatively by dimming the 395nm I get higher contrast. This will make it easier to get perfect contrast in alt process prints without needing toxic chemicals like dichromates, while also keeping the workflow fully analog (no digital negatives).
I'll be starting to use this to print malde/ware platinotypes over the coming month, and will update you guys on how it goes.
 Who knows, but I'm very skeptical based on how the electrochemistry would go for something like that. It's kind of unlikely that a sensitivity peak would accidentally occur for a wavelength that's far less energetic than the rest of it. That sort of thing is hard enough to engineer on purpose, let alone getting it as a free gift.