There have been a lot of questions on the latitude of this and that film and this and that paper.
I have taken some curves that I know are realistic and put them on paper for you to see.
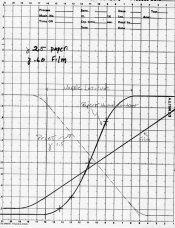
In the attached file, you will see 3 lines (curves). The horizontal (X) steps go from 1 - 21 and represent 0.15 Log E of exposure increments for each step. The vertical (Y) steps go from 0 to 3.6 and represent density units in 0.2 density units per vertical step.
The three curves are, in order of your normal use:
1. A normal professional film with a contrast of 0.60 taken from an actual coating.
2. A contrast grade 2.0 paper which has a mid scale contrast of 2.5. The four points marked on it are the speed (at D=1.0) and the ideal toe (2 points measured) and shoulder inflection point. Again taken from an actual coating.
3. A normal print from this combination of paper and film. It has a contrast of 1.50 which is 0.60 x 2.50 in the mid scale.
Curves #1 and #2 are to be found (or were last I looked) on the Kodak web site.
All three curves are defined mathematically by cubic splines.
The usable latitude at the ISO speed is the speed between the two vertical lines which are about 5 stops apart giving you a latitude of that much. In terms of film density, this is from 0.4 to 1.40. Of course the paper is fully used from Dmin to Dmax.
In the area of data loss, or compression, the actual 'reproduction rate' is the gamma of the film * gamma of the paper, but the film is constant and the paper is decreasing in the toe and shoulder areas, so the actual decrease in gamma of the paper imposed on the 0.6 gamma of the film results in a rapid data loss. I have drawn a sharp toe and shoulder in the print example I used, but in actuality, prints have much softer toe and shoulder curvature than what I have drawn.
I hope this explains some of the facts about films, papers and how they interact.
PE
I have taken some curves that I know are realistic and put them on paper for you to see.
In the attached file, you will see 3 lines (curves). The horizontal (X) steps go from 1 - 21 and represent 0.15 Log E of exposure increments for each step. The vertical (Y) steps go from 0 to 3.6 and represent density units in 0.2 density units per vertical step.
The three curves are, in order of your normal use:
1. A normal professional film with a contrast of 0.60 taken from an actual coating.
2. A contrast grade 2.0 paper which has a mid scale contrast of 2.5. The four points marked on it are the speed (at D=1.0) and the ideal toe (2 points measured) and shoulder inflection point. Again taken from an actual coating.
3. A normal print from this combination of paper and film. It has a contrast of 1.50 which is 0.60 x 2.50 in the mid scale.
Curves #1 and #2 are to be found (or were last I looked) on the Kodak web site.
All three curves are defined mathematically by cubic splines.
The usable latitude at the ISO speed is the speed between the two vertical lines which are about 5 stops apart giving you a latitude of that much. In terms of film density, this is from 0.4 to 1.40. Of course the paper is fully used from Dmin to Dmax.
In the area of data loss, or compression, the actual 'reproduction rate' is the gamma of the film * gamma of the paper, but the film is constant and the paper is decreasing in the toe and shoulder areas, so the actual decrease in gamma of the paper imposed on the 0.6 gamma of the film results in a rapid data loss. I have drawn a sharp toe and shoulder in the print example I used, but in actuality, prints have much softer toe and shoulder curvature than what I have drawn.
I hope this explains some of the facts about films, papers and how they interact.
PE