Methodology and Curve Interpretation

.

A
.

  • 1
  • 1
  • 9
Kentmere 200 Film Test

A
Kentmere 200 Film Test

  • 3
  • 1
  • 53
Full Saill Dancer

A
Full Saill Dancer

  • 1
  • 0
  • 93
Elena touching the tree

A
Elena touching the tree

  • 6
  • 6
  • 181
Graveyard Angel

A
Graveyard Angel

  • 8
  • 3
  • 136

Forum statistics

Threads
197,772
Messages
2,764,047
Members
99,466
Latest member
GeraltofLARiver
Recent bookmarks
0
Joined
Jan 7, 2005
Messages
2,603
Location
Los Angeles
Format
4x5 Format
I’ve been thinking about writing a post on methodology and the interpretation of a film curve when the thread it was for seems to have stalled. So I’ve decided to start a new thread on the topic instead.

Two of the most useful pieces of information that is generally derived from a film curve are film speed and contrast. I’m going to be addressing contrast. According to Contrast Measurement of Black and White Negative Materials, The British Journal of Photography, May 12, 1967, author either not listed or not copied, “

“Contrast measurements provide a practical guide to the photographer by enabling him to choose a development time for a given film in a given developer which will produce a negative suitable for his particular enlarger on his particular paper grade.”

“There are two basic ways of assessing contrast:
1. By measuring the slope of the straight line portion of the characteristic curve (gamma).
2. By measuring the average slope of the part of the characteristic curve that is most likely to be used in practice.”

While most manufacturers use some form of average gradient today, I believe that taking a look at gamma will help to emphasize the importance of using the method of interpreting a film curve that best comports to reality and real world results. The premise on gamma in C.J. Niederpruem, C.N. Nelson, and J.A.C. Yule, Contrast Index, Photographic Science and Engineering, Vol 10, 1966, is that gamma “is not always an appropriate basis for selecting proper development times for photographic for photographic films. It often fails when applied to films for which the D-log E curve have unusually long or unusually short toes because it does not take into account the fact that a portion of the toe of the curve is normally involved in the exposure of a typical negative.”

Here is how gamma, γ, is derived:

upload_2022-2-13_17-41-11.png


Next is an example of two films. Film B has a longer toe than Film A, but both curves meet at the same point representing the log exposure range of the camera image. This means that while the shape of each curve will produce prints differing in local tone reproduction, the prints will have the same reflection density range, or in other words, both will fit on the same grade of paper. In the example, however, they have different values for gamma.

upload_2022-2-13_17-44-26.png


Taking this as step further, the next example has gamma – time curves and contrast index – time curves (an average gradient method) for a medium toed and long toed emulsion. The development times for two films in the gamma – time curve that will produce films with the same gamma have relatively similar development times. In fact, the gammas are rather closely related throughout development. In stark contract is are the contrast index curves derived from the same family of curves as the gamma – time curve. It shows a far greater difference in development time need to produced negatives with the same contrast index. The paper also includes pictorial examples illustrating the differences.

upload_2022-2-13_17-43-44.png


Among the major film manufacturers, I believe only Agfa uses gamma and it is a modified version at that.

In a following post, I plan on reviewing the different average gradients. The distinction with average gradient comes with determining the best method when taking into consideration conditions differing from the statistical average.

Stephen
 

Bill Burk

Subscriber
Joined
Feb 9, 2010
Messages
9,157
Format
4x5 Format
Kodak contrast values are typically quoted in terms of “Contrast Index” (or CI for short). Contrast Index is a measure of “the average slope of the part of the characteristic curve that is most likely to be used in practice.”

The part of the curve that you are likely to use is the part that fits between the two arcs on this meter…

http://beefalobill.com/images/cntrastindexmeter.pdf
 

MattKing

Moderator
Moderator
Joined
Apr 24, 2005
Messages
52,122
Location
Delta, BC Canada
Format
Medium Format
I'm going to go out on a limb and make this thread a "Sticky".
 

ic-racer

Member
Joined
Feb 25, 2007
Messages
16,499
Location
USA
Format
Multi Format
Characteristics of any H&D curve are only as good as one's ability to measure them. I always thought the Contrast Index overlay, and it's cousin the Delta-X overlay were very clever tools. (Again, overlay image courtesy of Bill)
I use computer computations to get similar data from the curves , but this is Steve's thread and I'm looking forward to his further discussion.
fe298cc9-514f-4d3b-986b-5073a3af5937-jpeg.298095
 
Last edited:
OP
OP
Stephen Benskin
Joined
Jan 7, 2005
Messages
2,603
Location
Los Angeles
Format
4x5 Format
Gamma’s strict adherence to the straight line portion of the film’s characteristic curve means it neglects other sections and aspects of the curve. The toe, for instance, which at the time was known as the underexposure section, is used to some degree in most photographic fields. Short toed curves to a lesser degree than long toed curves. In fact, it’s with longed toed curves with a larger percentage of exposure falling in the toe and the tendency for non-linear straight line portions that makes Gamma inconsistent as an indicator of a film’s contrast.

The paper Contrast Measurement of Black and White Negative Materials, in the 1967 British Journal of Photography writes about gamma’s “inadequacies for describing the contrast of general purpose monochrome materials”; and that it “is of little use as a means of measuring negative contrast in general purpose photography.”

An alternative method of determining contrast is average gradient. It measures the average slope of the part of the characteristic curve that is most likely to be used in practice. “The average gradient of a segment of a curve can be thought of as the slope of a straight line joining the two end points of the segment.” One point of measurement is in the shadows, usually at 0.10 over Fb+f or a certain gradient of the toe. The other end is at some determined value of log-H. The range depends on the particular method and purpose of use.

A proposed average gradient method first appeared in a 1912 Journal of Photography article, but it wasn’t until Loyd Jones’ seminal tests that it was possible to move beyond assumptions based upon only the physicality of the curve and anecdotal evidence and to finally define the conditions and limitations that constitute a quality print. Jones’ fractional gradient method of speed evaluation uses an average gradient where the point in the shadow is located where the gradient is 0.3x the average gradient of the curve. It uses a range of 1.50 log-H.

Ilford introduced G-bar sometime in the mid-fifties which adopted the Δ1.50 log-H range while uses a fixed point of 0.10 for the shadow. As far as I can tell, Kodak never utilized their version of average gradient beyond its part in speed determination.

According to C.J. Niederpruem, C.N. Nelson, and J.A.C. Jule in their paper Contrast Index, “Experience has shown that it is necessary to develop continuous-tone negative materials having different curve shapes to a certain average gradient rather than to a certain gamma, if the negatives of an average subject are to be printed on the same medium grade paper.” For any version of average gradient to be accurately used to determine an aim development, it is critical the portion of the film curve measured be the part “most likely used in practice.”

Jones’s testing also determined the statistically average scene’s Luminance range. It has a value of 2.20 logs. In the forties and fifties, when Jones conducted his tests and Ilford introduced G-bar, the normal camera lens was uncoated and subject to a greater degree of flare then today’s lenses. This resulted in the use of a shorter range to measure average gradient. I’ve often wondered by Ilford never revised G-bar in the sixties.

The following example should help illustrate the importance of utilizing the curve “most used in practice.” It contains curves for Tri-X Professional 120 and Tri-X 135. They represent a standard long toed curve with an upsweep in the upper straight line portion, and an average toed curve and linear straight line portion. The log-H range used to measure the average gradient can greatly influence the resulting value. Both curves cross around a negative density range of 1.09 which can be considered the aim for a grade two paper with a diffusion enlarger. Whether this is the best log-H range to determine average gradient to be determined.

upload_2022-3-7_18-38-25.png


The first point has a Δ1.0 log-H and is the meter’s exposure point. The TXP has a density of 0.58 and TX is at 0.70. It would take an additional 2/3 stop exposure until TXP achieves the same density. The average gradients would be TXP = 0.48 and TX = 0.60. Obviously the meter’s exposure point isn’t an adequate place to measure for the film’s contrast, it also suggests how using aim densities for any points other than the end points is fairly impractical.

The second example has a Δ1.30 log-H and is the range of the ISO contrast parameters, sometimes call the ISO triangle. If average gradient was measured at this point the results would be TXP = 0.52 and TX = 0.60. Some people believe the ISO speed parameter represents the average gradient for normal contrast. It does not. The standard’s purpose is to define black and white negative pictorial film speeds only. This example also shows how the slope of the ISO parameter is 0.62 (0.80/1.30), the average gradient of the film may not be depending on how and where it is read. The TX is close to fitting the parameters, but TXP isn’t even though they would be considered the same average gradient if measured from the Δ1.80 log-H range.

The third point is at Δ1.50 log-H or Ilford’s G-bar and the fractional gradient method’s average gradient. If measured here, TXP = 0.56 and TX = 0.60. As the range moves to the left, TXP appears to have an increasing average gradient, while TX remains the same. As with Gamma, the long straight line portion of a shorter toed curve will tend to work with most methods. The predominantly linear curve is practically fool proof, but the long toed curve makes it difficult to find a method that is effective with both.

The fourth example measures where the two curves cross. It’s actually a little to the left of the Δ1.80 log-H range indicated on the graph. The density range falls Δ1.05 with a Δ1.75 l-H. Both have an average gradient of 0.60 at this point.

The fifth and final measurement is at a Δ2.10 which is close to the statistically average subject Luminance range of 2.20. Sometimes the third of a stop difference is left off in order to round down to a full 7 stop range. The Zone System also uses 7 stops for its testing from Zone I to Zone VIII, so it seemed appropriate to use 2.10 instead of 2.20 in this instance.

The two curves have swapped which one has the higher density at the specified exposure range. TXP still has about an average gradient of 0.60 and TX has dropped to 0.56.

If the idea is to pick a log-H range that best represents the use of the film curve and considering the statistically average Luminance range is 2.20 or 2.10, then the range that should work best is one at Δ2.10 log-H. Except it’s not that easy.
 
Last edited:

aparat

Member
Joined
Sep 5, 2007
Messages
1,177
Location
Saint Paul,
Format
35mm
I am sorry to have found this thread so late, but I was just thinking about contrast the other day, with reference to another thread, and this interesting thread came up in the Photrio search. I enjoyed reading the discussion!

I think that lot photographers use the terms Contrast Index (CI), Average Gradient (), and Gamma (γ) interchangeably, but, obviously, strictly speaking, these three parameters are not the same.

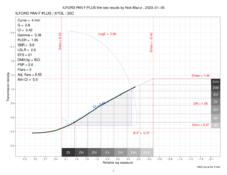
Sometimes, is calculated as the ratio of DR to LogE, which you can see marked in red in the plot below, but not always. I've seen a few different methods of calculating it in various textbooks and papers; mostly they vary with regard to the specific values of Δ log-H to be used, as @Stephen Benskin very nicely illustrated above.

So in this particular curve below, the CI is 0.42, is 0.4, and γ equals 0.38, so they are all very close. Personally, I don't mind using these three parameters interchangeably, as long as one does that consistently. After all, what matters is whether or not a particular method or approach helps the photographer obtain beautiful negatives and/or prints.
ilfordPanFPlots.pdfrelativeDescending_finalCIGGamma.png

Gamma is the slope of the straight-line portion of the curve. Identifying that straight line was often done "by eye" but it can also be derived by statistical analysis, which is what my program does. It is marked with the green dotted line. I use a k-means clustering vector quantization algorithm to identify the straight-line portion of the curve.

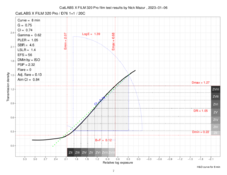
Here's an example of a curve where Gamma substantially diverges from both Ḡ and CI. Even though, the identified slope is "correct" mathematically, it may not be what the photographer subjectively wants. They may be more interested in the shadows or the highlights, and, in this case, the characteristic curve can be interpreted as having two distinctly different slopes, depending on what the photographer picks, subjectively.

This is particularly true of some of the more idiosyncratic curves, esp. s-shaped ones, which often produce divergent values for these three parameters. Here, γ=0.62, CI=0.74, and =0.75.

CatLABS_X_FILM_320_Pro_Combinedraw_dataPlots.pdfrelativeDescending_finalCIGGamma.png

Finally, CI, is often recommended to be calculated based on Kodak's graphical model (like the one @Bill Burk linked, thanks!). In my program, CI is also derived programmatically, rather than "graphically," using an algorithm that solves a system of nonlinear equations. In the plots above, it is marked with blue dotted lines. The results are going to be similar by both methods, as there is little potential ambiguity based on the photographer's subjective choices.

So, to sum up, I think that it is perfectly fine for a photographer to use whichever parameter they prefer and calculate it by whatever method they like. As long as it is done consistently, the more subjective methods can be just as effective as the more objective ones, but, in an automated, computer-aided characteristic curve analysis, the least subjective methods are obviously preferred.
 

ic-racer

Member
Joined
Feb 25, 2007
Messages
16,499
Location
USA
Format
Multi Format
I think any indicator of film's contrast is only as good as one's ability to measure it. Be it graph paper, a transparent overlay or other computer analysis. Personally I use a linear regression of the first 11 steps above 0.1 because it is quick and simple. I don't know of any software package that can calculate Contrast Index.
 
Joined
Aug 29, 2017
Messages
9,295
Location
New Jersey formerly NYC
Format
Multi Format
I'm very appreciative of the very hard work you did in researching and presenting this material. Could you sum up simply for us less technically inclined photographers how we could apply this information to help in our photography? Thanks.
 

aparat

Member
Joined
Sep 5, 2007
Messages
1,177
Location
Saint Paul,
Format
35mm
I think any indicator of film's contrast is only as good as one's ability to measure it. Be it graph paper, a transparent overlay or other computer analysis. Personally I use a linear regression of the first 11 steps above 0.1 because it is quick and simple. I don't know of any software package that can calculate Contrast Index.
I agree completely. In the end, the method doesn't matter, as long as the photographer can use it to their satisfaction.
The reason why I implemented the CI method in my program was to give photographers a chance to calculate it easily and then decide if it works for them.

Linear regression, as I am sure you know, does not fit the film characteristic curve perfectly, but I don't deny that it can be used effectively.

A lot of the early work in sensitometry (first half of the 20th. century) used a mathematical model of the characteristic curve that had a distinct toe and a distinct straight-line portion. That works for a lot of films and developers, but not for all of them.

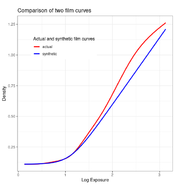
Here's an example of an "actual" curve (CatLABS X FILM 320 Pro, in red) and a "synthetic" curve generated by my program based on the "toe-straight line" curve model mentioned above (in blue). As you can see, the curves diverge quite significantly, despite having nearly identical toes. However, the Average Gradient (0.54, 0.52) and Contrast Index (0.56, 0.53) are fairly robust against the s-shape of the curve, but Gamma (0.55, 0.42) is not. Having said that, if one is able to consistently apply Gamma or linear regression to the "actual" curve, it's not a problem, whatsoever.
curveComparisonS-shapedStraight.png
 

aparat

Member
Joined
Sep 5, 2007
Messages
1,177
Location
Saint Paul,
Format
35mm
I'm very appreciative of the very hard work you did in researching and presenting this material. Could you sum up simply for us less technically inclined photographers how we could apply this information to help in our photography? Thanks.
Great question! I will let the OP explain his excellent work on measuring contrast. I will just include a link to a PDF by Ralph W. Lambrecht and Chris Woodhouse that explains all of those concepts in great detail.
It links to a Photrio thread and PDF so you probably want to "Save as" or something like that.
 

aparat

Member
Joined
Sep 5, 2007
Messages
1,177
Location
Saint Paul,
Format
35mm
Stephen Benskin often refers to this article describing Contrast Index:


I like CI because it measures the part of the curve that you are probably going to use.

Absolutely! I like the way you incorporated the graphical overlay into your analysis.

I would encourage people trying to compute CI to use the graphical "calculator" on p. 38. There is a higher-quality image available in Way Beyond Monochrome (Lambrecht and Woodhouse), which is a great resource for people trying to learn about interpreting the characteristic curve.
 

MurrayMinchin

Membership Council
Subscriber
Joined
Jan 9, 2005
Messages
5,468
Location
North Coast BC Canada
Format
Hybrid
I'm very appreciative of the very hard work you did in researching and presenting this material. Could you sum up simply for us less technically inclined photographers how we could apply this information to help in our photography? Thanks.
The book, "The New Zone System Manual" by Minor White, Richard Zakia, and Peter Lorenz is a great book for those who don't naturally think like a sensitometrist. I think it's out of print, so try to get one of the later printings/editions.

It helped me shake loose from much of the 'rules' usually applied to the Zone System, like visualizing things from a bi-directional point of view, where exposure and development centre around keeping Zone V steady, instead of placing things at the low end of things and developing for the high tones.

I claim not even a glimmer of competency around how much of this stuff is generated or interpreted, but recognize the vital role it plays in establishing relationships between film, paper, and chemistry.

Having a sense of what curve shape means does come in handy, as I've begun learning how to make salt prints via digitally enlarged negatives, have been manually experimenting with curve shapes in Capture One, and the images don't look spectacularly awful.

A hearty back-slap to those of you who grind out the details for the rest of us to springboard off of!
 
Last edited:

ic-racer

Member
Joined
Feb 25, 2007
Messages
16,499
Location
USA
Format
Multi Format
Linear regression, as I am sure you know, does not fit the film characteristic curve perfectly, but I don't deny that it can be used effectively.

The line (in my simple spreadsheet) serves as both the x-incercept and gamma, both of which are the foundation of the W-speed method which is easy to calculate with basic spreadsheet tools, or more specifically, have the spreadsheet calculate for me. W-speed is essentially a modification of Inertia (x-intercept) to bring the speed result it into agreement with Delta-X and 0.3G.
 
Last edited:

ic-racer

Member
Joined
Feb 25, 2007
Messages
16,499
Location
USA
Format
Multi Format
Absolutely! I like the way you incorporated the graphical overlay into your analysis.

I would encourage people trying to compute CI to use the graphical "calculator" on p. 38. There is a higher-quality image available in Way Beyond Monochrome (Lambrecht and Woodhouse), which is a great resource for people trying to learn about interpreting the characteristic curve.
Did your software draw that "CI Calculator" and get the number or did you do it? (Post #6)
 

aparat

Member
Joined
Sep 5, 2007
Messages
1,177
Location
Saint Paul,
Format
35mm
Did your software draw that "CI Calculator" and get the number or did you do it? (Post #6)

My software does this automatically and plots the circle segments and lines that are part of Kodak's definition of CI. It also prints the CI value along the CI triangle hypotenuse.
 

ic-racer

Member
Joined
Feb 25, 2007
Messages
16,499
Location
USA
Format
Multi Format
I read so many forums, forgive me if I asked this already, but will this be something for sale?
 

Bill Burk

Subscriber
Joined
Feb 9, 2010
Messages
9,157
Format
4x5 Format
Kodak contrast values are typically quoted in terms of “Contrast Index” (or CI for short). Contrast Index is a measure of “the average slope of the part of the characteristic curve that is most likely to be used in practice.”

The part of the curve that you are likely to use is the part that fits between the two arcs on this meter…

http://beefalobill.com/images/cntrastindexmeter.pdf

For anyone who wants to try this graphically, these are to fit US Letter with no margins… If you can print the Contrast Index Meter on overhead material on the same printer as the charts they will align.


https://beefalobill.com/images/cntrastindexmeter.pdf
 

aparat

Member
Joined
Sep 5, 2007
Messages
1,177
Location
Saint Paul,
Format
35mm
I read so many forums, forgive me if I asked this already, but will this be something for sale?

When it's ready, it will be free. Right now, the program has a command line interface, but I just started working on the web interface for it. I am still in the early stages, so it will take a while. Meanwhile, I am trying to figure out what features people would find useful and important.
 

aparat

Member
Joined
Sep 5, 2007
Messages
1,177
Location
Saint Paul,
Format
35mm
For anyone who wants to try this graphically, these are to fit US Letter with no margins… If you can print the Contrast Index Meter on overhead material on the same printer as the charts they will align.


https://beefalobill.com/images/cntrastindexmeter.pdf
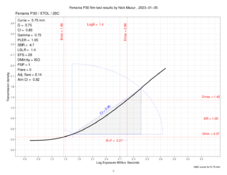
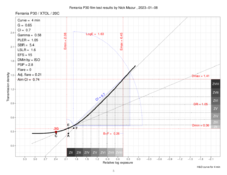
This is very useful. There's a similar calculator in Way Beyond Monochrome. I think both CI and G are very reliable measures of contrast, but CI tends to diverge from G for curves with significant curvature in the mid-tones, such as this Ferrania P30 curve below. Here, Gamma=0.75, G=0.75 and CI=0.85, and this could be, potentially, important, esp. for sheet film photographers who need precise exposure and development. Yes, I know P30 is not available in 4x5 but the TRI−X 320 is. One important thing about CI is that its definition is unambiguous.

ferraniaP30Plots.pdfabsolute_finalCIvsG.png
 

aparat

Member
Joined
Sep 5, 2007
Messages
1,177
Location
Saint Paul,
Format
35mm
Speaking of Delta-X and the use of graphical "calculators," I also implemented a method to predict fractional-gradient speed and many of the associated parameters, such as Delta-X, ω speed, etc., programmatically, so that one does not need to use graphical calculators or meters.
ferraniaP30FractGradientDemo.png
 

ic-racer

Member
Joined
Feb 25, 2007
Messages
16,499
Location
USA
Format
Multi Format
Wow, keeps getting better!!

What software are you using? Are you coding all the analysis or do you have some package with routines to call. I used to do a lot with C++ on the Mac but nothing recently.
 

aparat

Member
Joined
Sep 5, 2007
Messages
1,177
Location
Saint Paul,
Format
35mm
Wow, keeps getting better!!

What software are you using? Are you coding all the analysis or do you have some package with routines to call. I used to do a lot with C++ on the Mac but nothing recently.

Thanks! I have written the program from scratch, but, of course, I have used existing libraries for things like printing to a PDF device and writing PNG images to disk. I am currently working on a JavaScript-based user interface, so the program can be used from any web browser or via a mobile app.
 

aparat

Member
Joined
Sep 5, 2007
Messages
1,177
Location
Saint Paul,
Format
35mm
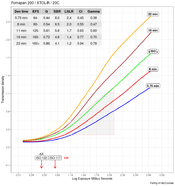
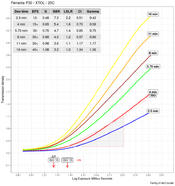
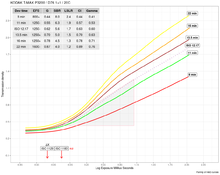
To follow up on my previous post regarding estimating fractional gradient and related parameters, I wanted to show how there's an option in my program to calculate ΔX speed for the family of curves, displayed next to ISO film speed. Likewise, 0.3Ḡ speed and W speed are also computed and can be displayed on the plot, if needed. In some cases, ΔX speed will be higher, in some it will be lower, than the ISO film speed. In one case, it will be equal. I was able to find examples of all three in my files. The usefulness of these "alternative" speeds is up to the individual user. I am not claiming one being more accurate than the other, though I typically go by the ISO speed simply because most photographers are familiar with it.

fomapan200CurveFamilyDeltaX.png ferraniaP30FamilyDeltaX.png tmaxp3200FamilyDeltaX.png
 
OP
OP
Stephen Benskin
Joined
Jan 7, 2005
Messages
2,603
Location
Los Angeles
Format
4x5 Format
To follow up on my previous post regarding estimating fractional gradient and related parameters, I wanted to show how there's an option in my program to calculate ΔX speed for the family of curves, displayed next to ISO film speed. Likewise, 0.3Ḡ speed and W speed are also computed and can be displayed on the plot, if needed. In some cases, ΔX speed will be higher, in some it will be lower, than the ISO film speed. In one case, it will be equal. I was able to find examples of all three in my files. The usefulness of these "alternative" speeds is up to the individual user. I am not claiming one being more accurate than the other, though I typically go by the ISO speed simply because most photographers are familiar with it.

View attachment 326280 View attachment 326281 View attachment 326282

So which curve in each are you applying ΔX to?
 
Photrio.com contains affiliate links to products. We may receive a commission for purchases made through these links.
To read our full affiliate disclosure statement please click Here.

PHOTRIO PARTNERS EQUALLY FUNDING OUR COMMUNITY:


Ilford ADOX Freestyle Photographic Stearman Press Weldon Color Lab Blue Moon Camera & Machine
Top Bottom