


I wanted to share my first use of the Printalyzer Densitometer to produce a set of paper curves. I followed the procedure in Steve Anchell's book, "Variable Contrast Printing Manual". I projected the 21-step wedge and exposed 7 sheets of Ilford MG RC Deluxe, one for each filtration setting (#00, #0, #1, #2, #3, #4, #5); I chose not to test half-grade settings. If I was a contact printer I would've contacted the wedge, it was advised to conduct this test following your usual printing manner. Yes, I'm aware of potential flare issue that may be impacting the data, but......flare be damned, just sayin.
In Anchell's words, this is a test for "Relative ISO Range Numbers"........generated relative to all that's involved with my equipment and process..........the paper, light source, filtration, developer, dilution, dev time/temp, and toner. The book states....."Theoretically, a paper's ESV (my emphasis: exposure scale value, or LER I believe) should change with each contrast filter. In practice this is not always true. Sometimes two or more adjacent filters do not provide enough change in color density to effect a change in contrast on a particular brand of paper." So this is why I am doing this test, some may say what a waste of 7 sheets of paper, however, knowing if this situation exists in my system, I believe it can help avoid paper waste when printing.
My system/process:
-LPL 4550 XLG VCCE enlarger, quartz-halogen light source with Ilford dial-in filtration settings.
-Dektol 1+3, 3 min dev time
-selenium toning, 1+10
-Ilford Stop
-Kodak rapid fix
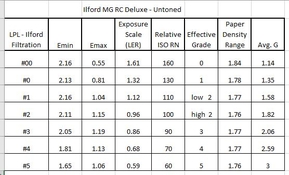
Relative ISO RN: (Emin - Emax) x100 round to the nearest 5.
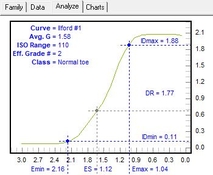
Analysis: BTZS Plotter for Windows: One data set by reading reflection densities before toning and one data set by reading reflection densities after toning the paper. Also, the paper curves of the three curves that are of most interest to me in that it shows #0 filtration provides an effective contrast grade of 1 and that filtration #1 provides a low grade 2 contrast, and the filtration #2, remains a grade 2 but provides a bit higher grade 2 contrast than #1. Filtration settings for both untoned and toned paper provide unchanging effective grades, so not enough of a change due to toning. But, I believe, it does reveal a level of difference that selenium toning has had on the paper's overall response to toning, using the increases shown in Emin, Emax, ESV, and in other columns of data. I know this response can be easily seen on the paper, but seeing it measured in the paper densities, I think is a cool thing to observe....no, I haven't forgotten about potential flare impacts.


BTZS paper curves for the untoned curves: #0, #1, #2:


BTZS paper curves after toning in selenium 1+10:


I know some expert eyes will be looking at this so I've tried to be as thorough as I can. I'm interested in thoughts and constructive critique.
In Anchell's words, this is a test for "Relative ISO Range Numbers"........generated relative to all that's involved with my equipment and process..........the paper, light source, filtration, developer, dilution, dev time/temp, and toner. The book states....."Theoretically, a paper's ESV (my emphasis: exposure scale value, or LER I believe) should change with each contrast filter. In practice this is not always true. Sometimes two or more adjacent filters do not provide enough change in color density to effect a change in contrast on a particular brand of paper." So this is why I am doing this test, some may say what a waste of 7 sheets of paper, however, knowing if this situation exists in my system, I believe it can help avoid paper waste when printing.
My system/process:
-LPL 4550 XLG VCCE enlarger, quartz-halogen light source with Ilford dial-in filtration settings.
-Dektol 1+3, 3 min dev time
-selenium toning, 1+10
-Ilford Stop
-Kodak rapid fix
Relative ISO RN: (Emin - Emax) x100 round to the nearest 5.
Analysis: BTZS Plotter for Windows: One data set by reading reflection densities before toning and one data set by reading reflection densities after toning the paper. Also, the paper curves of the three curves that are of most interest to me in that it shows #0 filtration provides an effective contrast grade of 1 and that filtration #1 provides a low grade 2 contrast, and the filtration #2, remains a grade 2 but provides a bit higher grade 2 contrast than #1. Filtration settings for both untoned and toned paper provide unchanging effective grades, so not enough of a change due to toning. But, I believe, it does reveal a level of difference that selenium toning has had on the paper's overall response to toning, using the increases shown in Emin, Emax, ESV, and in other columns of data. I know this response can be easily seen on the paper, but seeing it measured in the paper densities, I think is a cool thing to observe....no, I haven't forgotten about potential flare impacts.
BTZS paper curves for the untoned curves: #0, #1, #2:
BTZS paper curves after toning in selenium 1+10:
I know some expert eyes will be looking at this so I've tried to be as thorough as I can. I'm interested in thoughts and constructive critique.
Attachments
Last edited: