


JeffD
Member
Hello,
I have been following the methodology listed in the howto articles for sandwiching a stouffer wedge card over my film, and exposing, in camera, to a zone 10 exposure (metered value, plus 5 stops):
(there was a url link here which no longer exists)
Ok, I am hoping someone can help explain my results. Here are the details:
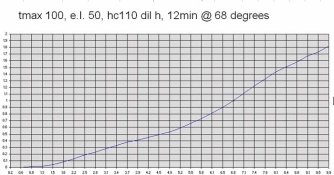
Tmax 100, exposed as e.i. 50 developed in a jobo drum, constantly spinning on a beseler motor roller developed in hc110, dilution H (half the dilution of B) for 12 minutes, 68 degrees
I have a densitometer which is acurately calibrated against a calibrated stouffer wedge.
For each "patch" on my stouffer wedge, I figured out what zone exposure it was allowing my film to be exposed to. For instance, "patch" number one has a density of .04, therefore, I am giving my film, behind the wedge, an equivalent to a zone exposure of 9.87.
math: 10 - (.04 / .3)
Ok, so, I plot out all my density results (y axis) against the derived zone exposures, (x axis), and the enclosed jpeg shows my plotted curve. The film base plus fog has already been removed from the data before plotting.
Question:
Aside from the exessive contrast (I should probably use a time closer to 10 minutes, for normal), why is my film speed low?
For my purposes, I am determining film speed by thinking that zone 1 exposure should be .1 . According to my chart, this speed is not reached until nearly zone 1.8, making TMAX 100, rated at e.i. 50 still needing to be bumped down to nearly e.i. 25!!! This doesn't seem right! I don't know of anyone deducting two full stops of speed from this film.
Any ideas?
Thanks!!
PS
Here is the spreadsheet, if anyone who is going through something similar wants to use it, or look at it:
http://www.hiddenworld.net/misc/curve.xls
.
I have been following the methodology listed in the howto articles for sandwiching a stouffer wedge card over my film, and exposing, in camera, to a zone 10 exposure (metered value, plus 5 stops):
(there was a url link here which no longer exists)
Ok, I am hoping someone can help explain my results. Here are the details:
Tmax 100, exposed as e.i. 50 developed in a jobo drum, constantly spinning on a beseler motor roller developed in hc110, dilution H (half the dilution of B) for 12 minutes, 68 degrees
I have a densitometer which is acurately calibrated against a calibrated stouffer wedge.
For each "patch" on my stouffer wedge, I figured out what zone exposure it was allowing my film to be exposed to. For instance, "patch" number one has a density of .04, therefore, I am giving my film, behind the wedge, an equivalent to a zone exposure of 9.87.
math: 10 - (.04 / .3)
Ok, so, I plot out all my density results (y axis) against the derived zone exposures, (x axis), and the enclosed jpeg shows my plotted curve. The film base plus fog has already been removed from the data before plotting.
Question:
Aside from the exessive contrast (I should probably use a time closer to 10 minutes, for normal), why is my film speed low?
For my purposes, I am determining film speed by thinking that zone 1 exposure should be .1 . According to my chart, this speed is not reached until nearly zone 1.8, making TMAX 100, rated at e.i. 50 still needing to be bumped down to nearly e.i. 25!!! This doesn't seem right! I don't know of anyone deducting two full stops of speed from this film.
Any ideas?
Thanks!!
PS
Here is the spreadsheet, if anyone who is going through something similar wants to use it, or look at it:
http://www.hiddenworld.net/misc/curve.xls
.
Attachments
Last edited by a moderator: