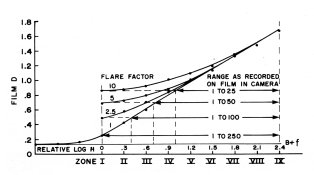
Henry's book shows the effects of flare on the film's characteristic curve. This has long been the standard approach (up until computers became common); however, it doesn't represent how flare really works. It's a construct for the sake of simplification and easier than drawing a separate flare / camera image curve.

The one thing this type of graph does very effectively show is the reduced gradient caused by flare. Still, my belief is that the film's characteristic curve is a graphic depiction of how the film responds to exposure under specified processing conditions. An exposure of a given log-H will always fall at the same point on the curve. What the Henry curve does is to take what the density would be at Zone II 1/2 and places it on Zone I. But what really happens is flare moves the Zone I exposure to the right along the X-axis and it becomes the exposure where Zone II 1/2 would be in a non-flare situation.

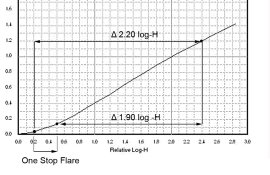
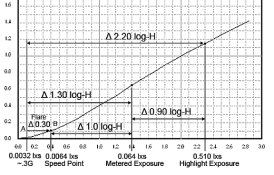
The above graph is how one stop of flare works. The shape of the film curve doesn't change, the optical image is what has changed in relation to the original image. This is why it's important to have no flare testing (if curve plotting is involved). As flare has little effect on the higher exposure values, the placement of the highlight exposure doesn't move. With the shift in the placement of the shadow exposure, the effective scene luminance range has shortened by one stop from a range of 2.20 to 1.90 (statistically normal flare is generally calculated at 0.34 to 0.40 reducing the illuminance range to 1.86 to 1.80). Normal processing would then be for a 6 1/3 stop range and not the original scene's 7 1/3 stop range.
The reason why most people don't have to worry about film with exposure is because it is built in (and as explained in the last paragraph). Without the effects of flare, the shadow exposure would fall approximately one stop further to the left. Flare moves the shadow exposure back up. The ISO film speed standard tests under no flare conditions, but factors in flare. For a 125 speed film, log-H at speed point should equal 0.0064 lxs.

Published processing times also have flare factored in. Kodak's normal CI is 0.58. A statistically average scene has a luminance range of 2.20. The average grade 2 LER aim for a diffusion enlarger is 1.05. Based on the rise over run equation, these two stats would produce a CI of 0.48. If flare reduces the apparent luminance range by 0.40 making it 1.80, the resulting CI would be 0.58. So if you follow the instructions, you don't need to worry about normal flare.
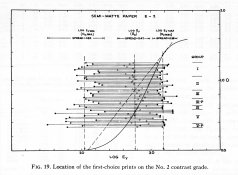
Now the amount of flare tends to change with changes in luminance range. How this is handled can require some attention, but other factors can contribute to make any extra effort unnecessary. I like to keep the following graph in mind.

This shows the density ranges of negatives, that were judged to produce prints with excellent print quality, superimposed over the paper curve which they were printed on. Notice the diversity of NDRs. They all produced great prints. How precise does anyone actually have to be? Could this be the reason why good images are made regardless of the approach? The way I see it. Aim for the center. Even with all the potential variables and variances, you'll still hit the target.


