• Welcome to Photrio!
    Registration is fast and free. Join today to unlock search, see fewer ads, and access all forum features.
    Click here to sign up

Film granularity/LPM chart

Forum statistics

Threads
201,654
Messages
2,827,975
Members
100,869
Latest member
AnthonyMoorePhoto
Recent bookmarks
0

Photo Engineer

Subscriber
Allowing Ads
Joined
Apr 19, 2005
Messages
29,018
Location
Rochester, NY
Format
Multi Format
Actually, sharpness should be expressed as MTF, or modulation transfer function. This plot, given on the Kodak web site for many products shows how a product responds at a given frequency of lines. More modern methods were under development at Kodak. One of the people in the forefront of this was Mike Kriss who has produced mathematical representations of a film's Information Capacity. This is published in the SPSE book "Color: Theory and Imaging Systems". It is a very long and math heavy exposition that I will leave to Kirk Keyes to explain. :D

I recently sent Kirk a copy of the article.

PE
 

Kirk Keyes

Member
Allowing Ads
Joined
Jun 17, 2004
Messages
3,234
Location
Portland, OR
Format
4x5 Format
Recently - that was two years ago... Since the birth of my daughter, it doesn't take much math to make my head hurt... I still have not finished. But it's right here on my desk for when I'm mentally capable of finishing it!
 

Photo Engineer

Subscriber
Allowing Ads
Joined
Apr 19, 2005
Messages
29,018
Location
Rochester, NY
Format
Multi Format
I have both the Kodak charts and the USAF targets here. I have both in negative and positive format. I may get around to posting images of them someday. I have used the Kodak charts in testing the sharpness of my hand coated papers and have posted some of the results here on APUG.

Kirk has seen my USAF targets.

PE
 

Kirk Keyes

Member
Allowing Ads
Joined
Jun 17, 2004
Messages
3,234
Location
Portland, OR
Format
4x5 Format
I played with the USAF targets for a while. It takes a little work to balance the exposure to get the positive and negative chart results to be close. And it takes a little work when using an enlarger to get sharp results - a point source would be better than an enlarger. I racked mine all the way up and used a small aperature to get better results.

Trying to be fair when reading the results, I was able to get Fuji Acros to read about 160 lpmm.

Kirk
 

RobC

Member
Allowing Ads
Joined
Nov 5, 2007
Messages
3,880
Location
UK
Format
Multi Format
There's plenty available charts photographing from here: http://www.normankoren.com/Tutorials/MTF5.html

But printing them accurately so that you can photograph them is another matter although if you do your calculaltions and have the lens far enough away, then its possible. But you ain't going to prove that the manufacturers numbers are wrong. All you can do is find out how much resolution you can get out of your own system.
 

Photo Engineer

Subscriber
Allowing Ads
Joined
Apr 19, 2005
Messages
29,018
Location
Rochester, NY
Format
Multi Format
Kirk; Using the resolution charts that I have, the positive and negative exposures should match to determine the effect properly.

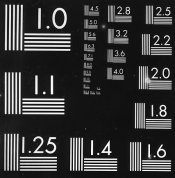
Rob; Excellent description of MTF. I'm not sure that what the chart shows is of line pairs though. The chart I have attached is more typical of line pairs. It is also more commonly called a definition chart as the definition of the film or print is determined by the last resolvable set of pairs. There are usually 4 lines or a set of "pairs" in this case.

The chart shown in the article is a typical MTF chart which is read at multiple densities to give resolution as a function of exposure. Reading two lines of unequal widths is, in this case, called a line pair which is a misnomer. So, in some cases it depends on the math used for analysis, the definition used, and not the chart which is clearly NOT line pairs.

The chart I have posted here shows pairs, but is never (AFAIK) used for MTF plots.

PE
 

Attachments

  • print def baryta.jpg
    print def baryta.jpg
    55.7 KB · Views: 129

Photo Engineer

Subscriber
Allowing Ads
Joined
Apr 19, 2005
Messages
29,018
Location
Rochester, NY
Format
Multi Format
BTW, on my monitor, the resolution or defintion is about 5.6. This is the last point at which I can see pairs of lines and resolve 4 lines in a group. At the next highest number I see 3 lines. This is partly an effect of the digital scanning process and partly an effect of the sharpness of the paper that was used to make the print.

PE
 

RobC

Member
Allowing Ads
Joined
Nov 5, 2007
Messages
3,880
Location
UK
Format
Multi Format
Well since it is a jpeg it is really meaningless. You should have made it a gif if you want see how good everyones monitor is. But 5.6 or 6.3 means nothing on screen since its scale has been altered by the screen and everyones will be different.
 

Photo Engineer

Subscriber
Allowing Ads
Joined
Apr 19, 2005
Messages
29,018
Location
Rochester, NY
Format
Multi Format
Of course Rob. I know that! I used it merely as a means for someone to understand how the chart is read and that is all, and that is why I mentioned the scanning problem. Given that though, a jpeg and a gif image of the same scan at the same size can be compared and a result can show the difference in loss in the jpeg as one example that is useful here. A comparison of the jpeg on different monitors is also useful to show how the monitor or driver affects resolution.

All things are relative. You just need all of the information and you need to know what you are doing.

PE
 
Photrio.com contains affiliate links to products. We may receive a commission for purchases made through these links.
To read our full affiliate disclosure statement please click Here.

PHOTRIO PARTNERS EQUALLY FUNDING OUR COMMUNITY:


Ilford ADOX Freestyle Photographic Stearman Press Weldon Color Lab Blue Moon Camera & Machine
Top Bottom