Film curve plotting and fitting

Girraween

A
Girraween

  • 0
  • 0
  • 14
mirrorculous

A
mirrorculous

  • 2
  • 0
  • 589
The Lady In Black

A
The Lady In Black

  • 0
  • 0
  • 788
Lady in Black

A
Lady in Black

  • 6
  • 0
  • 861

Forum statistics

Threads
199,874
Messages
2,797,986
Members
100,064
Latest member
RonnieP
Recent bookmarks
1
Joined
Jan 7, 2005
Messages
2,663
Location
Los Angeles
Format
4x5 Format
No, you can set the speed point at any density or zone you like. There is no need to set the speed point to 0.1D, in fact, I think there are several arguments against it. Toe shape and shadow compression to be one, the flare issue you mentioned being another.

Wow! Ralph, wake-up and read the post. I said the exact opposite from what you are implying I said. And please stop giving canned Photo 101 answers.

Okay, here's the argument for. Let's look at why .10 is the speed point. It isn't because it is the lowest usable density. It is used because at the contrast parameters of the ISO standard, the conditions match the fractional gradient conditions. So, the speeds will correspond with those produced by the fractional gradient method. It also guarantees that there is a consistent gradient for any film type. As Jones has pointed out, density has nothing to do with the determination of print quality. The determining factor is always gradient. In addition, any speed determination using 0.10 fixed density method when the development is outside the ISO parameters loses the correlation between the resulting speeds and the FG method, and thus the psychophysical testing results.

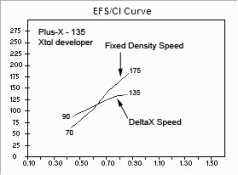
As with the FG method and the 0.10 fixed density method, the speed point isn't where the exposure is supposed to fall, but it is a dependable place to calculate speed from. The FG method used 1/E then divided the speed number by 4. While the FG's speed point for normal development is around one stop to the left of the 0.10 fixed density's speed point, the resulting speeds are not one stop faster but one stop slower. The Delta-X method which produces equivalent results as the FG method has adjusted the constant to produce the same results for the fixed density method at normal development.

From this, we can conclude that the most accurate and consistent method the determination of any alternative film speed would be to use one of the two methods with Delta-X being the most accurate and use a different constant. For the fixed density method, instead of using .8/H, you would use .6/Hm. Using an arbitrary density value to determine film speed without any knowledge of the local gradient introduces potential variation in the range of quality with the results do to different film characteristics. One film could respond. This argument can be used for any value that doesn't consider gradient. That is one of my arguments against ZS testing. Without considering how the speed method relates to directly with print quality you will only wind up with a less accurate rule of thumb. Simply using the 0.10 fixed density method and adding 1/2 stop more exposure is more accurate than picking an arbitrary density as speed point.

I want to be clear that this is an issue about speed determination and not exposure placement. The First Excellent Print test shows that quality is maintained for at least a two stop range of exposure over the first excellent print exposure. ASA speeds prior to 1960 were one stop faster than today. There's no question that there is a range of exposure that will still produce quality results (the degree is primarily dependent on format size). It's not like it's any great discovery.

Will giving more exposure than indicated using any method of speed determination place the exposure further up the curve? Yes. Does that increase the the gradient in the shadows? Yes. But the question comes down to a consistent method to accomplish it.

What are your arguments against 0.10 or the Delta-X/Fractional gradient methods.
 
Last edited by a moderator:
Joined
Jan 7, 2005
Messages
2,663
Location
Los Angeles
Format
4x5 Format
Yes, for any given material, you can relate densities to zones, and in my experience, many modern films and papers behave similarly enough to publish rule-of-thumb tables.

I said "could be interpreted" that there are specific "fixed" densities. It was about the possible confusion take could come from the way you worded your post. That's all. I'm not questioning if there is a relationship between ZS and tone reproduction or what could be considered the standard model for Zone densities. Please read my posts more carefully.
 
Last edited by a moderator:

RalphLambrecht

Subscriber
Joined
Sep 19, 2003
Messages
14,706
Location
K,Germany
Format
Medium Format
I said "could be interpreted" that there are specific "fixed" densities. It was about the possible confusion take could come from the way you worded your post. That's all. I'm not questioning if there is a relationship between ZS and tone reproduction. Please read my posts more carefully.

Steve

You keep telling us that we should read your posts again or more carefully. You even went as far as telling me to wake up. Could the problem be with your posts?
 

RalphLambrecht

Subscriber
Joined
Sep 19, 2003
Messages
14,706
Location
K,Germany
Format
Medium Format
Originally Posted by RalphLambrecht
No, you can set the speed point at any density or zone you like. There is no need to set the speed point to 0.1D, in fact, I think there are several arguments against it. Toe shape and shadow compression to be one, the flare issue you mentioned being another.

Originally Posted by Stephen Benskin
Wow! Ralph, wake-up and read the post. I said the exact opposite from what you are implying I said. And please stop giving canned Photo 101 answers.

Earlier Post by Stephen Benskin
... I was attempting make a conceptual point that it is only Zone I 1/2 if you begin measuring the Zones at .10 but since you are beginning at 0.17 shouldn't it be considered the new Zone I just for conceptual purposes? ..


Steve

My response was to your last statement above.
Please make sure this conversation stays civilized!
 
Joined
Jan 7, 2005
Messages
2,663
Location
Los Angeles
Format
4x5 Format
Originally Posted by RalphLambrecht

My response was to your last statement above.
Please make sure this conversation stays civilized!

Sorry Ralph,

We have frequent points of disagreement with theory, but in general we agree on the basic concepts of practice. You know my theory is stong. I don't condesend to you so I would appreciate the same consideration. I shouldn't allow myself to get frustrated. For that, I apologize.

However, back to the discussion. "There is no need to set the speed point to 0.1D, in fact, I think there are several arguments against it." What are those arguments? And remember, we are talking about speed determination and not exposure placement.

Let me also attempt to explain my simple point about your statement that using 0.17 as the speed point as being Zone 1 1/2. I was pointing out that it would only be considered that if you still maintained the premise that 0.10 was Zone I. You are only changing the EI which shifts everything up the curve. Zone I for a 200 speed film rated at 200 is still considered Zone I with the same 200 speed film rated at 150 only they have a 1/2 stop difference in placement on the film curve. It doesn't become a Zone 1 1/2 just because the film was underrated. I know you know this, it's just that the way it was written in you post could have confused some people and I was trying to help you clarify it.
 
Last edited by a moderator:

RalphLambrecht

Subscriber
Joined
Sep 19, 2003
Messages
14,706
Location
K,Germany
Format
Medium Format
Steve

This thread was about film curve plotting and not about speed determination or exposure placement. You are just trying to steer it towards your favorite subject again. In any case, as long as you believe that I purposely misinterpret what you say just to change the subject, there is really no need to continue, because your mind won't be open to what I'm trying to tell you. It's too bad, because there are a lot of synergies. You are just making things too complicated.
 
Joined
Jan 7, 2005
Messages
2,663
Location
Los Angeles
Format
4x5 Format
Ralph,

Nice save. In this thread I addressed David's data and how it was determined. I talked on that point and gave him reading material and reading suggestions for further study. You brought up your favorite subject of 0.17 as a speed point. Now, who is calling the kettle black?

I was asking you to support your statement for David's sake, you brought up that 0.10 may not be the best choice for the speed point and that there were arguments to support that claim. I'm just asking you to further explain that statement. IMO, it would be beneficial for David to know why he should use a given method. But read into as you like.
 

RalphLambrecht

Subscriber
Joined
Sep 19, 2003
Messages
14,706
Location
K,Germany
Format
Medium Format
Steve

I have already answered that question. I don't like a speed point that low on the characteristic curve because it overemphasizes the importance of a toe, which has little bearing on pictorial values. Moving the speed point to a higher density value 'strips' flat toe values and concentrates on contrast that are more relevant to film characteristics.

To save myself from the unavoidable fractional-gradient discussion, which undoubtably will follow, I'm out of here.
 

Photo Engineer

Subscriber
Joined
Apr 19, 2005
Messages
29,018
Location
Rochester, NY
Format
Multi Format
Steve

I have already answered that question. I don't like a speed point that low on the characteristic curve because it overemphasizes the importance of a toe, which has little bearing on pictorial values. Moving the speed point to a higher density value 'strips' flat toe values and concentrates on contrast that are more relevant to film characteristics.

To save myself from the unavoidable fractional-gradient discussion, which undoubtably will follow, I'm out of here.

Well, I have to say that I agree with this POV and in fact is what I have been saying all along but using different words.

Anything on the toe or shoulder, even if it fits the so called zone system, is rather meaningless.

PE
 
OP
OP

dpgoldenberg

Member
Joined
Feb 18, 2009
Messages
50
Format
Med. Format RF
Steve, Ralph and PE,

With some trepidation, I am stepping back into the discussion. It seems to me that most of the disagreement on this subject comes down to about 1 stop. As I now understand the major film speed methods, they are based on or assume the following (with some approximation):

1. The pre-1960 ASA method was based on a speed point where fg=0.3, and the film speed was calculated such that this point corresponded to an exposure about 5-steps below that indicated by a calibrated meter. (Fig. 8, Nelson, C.N., Safety Factors in Camera Exposures, 1960). The useful luminance range was assumed to go down four stops from the indicated exposure, and the extra stop was considered a safety factor.

2. The revised ASA method included two changes. First, the fg=0.3 criterion was replaced with D=0.1. Testing showed that there was an approximately constant difference between these to points, especially when the negatives were developed to a constant contrast. With an average gradient of ~0.6, the fg=0.3 pt is about 1 stop lower than the D=0.1 point. Simply replacing the fg point with the D point (without changing the calculated ASA speeds) would have meant that the new speed point should be 4 stops below the metered point. At the same time, however, the ASA speeds were doubled, so that the D=0.1 point was now three stops below the indicated exposure. This was done in the belief that the 1-stop safety factor was no longer needed. The net result was that the low end of luminance range (-4 stops) was placed at the old speed point, where fg=0.3 and D is significantly less than 0.1.

3. The Adams Zone System method is designed to place an exposure 4 stops below the indicated exposure (Zone I) at a density of 0.1. Using the relationship between fg=0.3 and D=0.1, this is very close to the *old* ASA method and is expected to give speeds of about half of modern ASA values. From what I gather, this is just about what most people who use the ZS method find. In essence, this brings the speeds back in line with the original ASA method and keeps more contrast in Zone I.

The arguments seem to have to do with whether or not one should try to take advantage of 1 stop of exposure in the toe region or not. I would just point out that the uncertainties in the practical measurements in all of this are substantial, and in practice the results depend on subjective judgments in metering. That could, in itself, be an argument for using the more conservative straight-line approach, but I also appreciate Steve's point that there are trade-offs to increasing exposure. (This is discussed quite clearly in the 1960 Nelson article, but I wonder if these trade off haven't shifted significantly as films have improved so much in the past 50 years.)

For what it is worth, my suggestions to anyone outside of this group who are reading all of this are:

1. If you feel compelled to get into the film testing business, choose a criterion for calculating speed values and try to be consistent in applying it. (That's what I was hoping that my nifty plotting and fitting program would be good for.)

2. Relax, take more pictures, and try not to underexpose the negatives!

Thanks to those who have participated in this discussion. I have learned from it (I think), and I hope that it hasn't caused too much frustration.

David
 

Bill Burk

Subscriber
Joined
Feb 9, 2010
Messages
9,383
Format
4x5 Format
Hi David,

Very nice summation. Going back to an earlier point in your idea of curve fitting where you thought it might be practical to mirror and flip the toe to represent the shoulder.

I'd say don't do that. My graphs of TMY-2 in D-76 1:1 show a slight upward trend with no apparent shoulder. So my data wouldn't fit such a curve.

I also think that wouldn't be a fair mathematical representation of the actual characteristics, since the shoulder and toe are independent.

I'd like to see curve fitting that could indicate 0.3 of the toe of the film. In the 1960s when the speed point changed to fixed 0.1 it was practical because there were no personal computers. As Steve pointed out it is about the same anyway at the ISO development conditions (and Europe used fixed - this allowed a universal standard). As Steve pointed out, those who stray to development times shorter than ISO development should use more of the toe. As Ralph pointed out, it would be nice to work on the paper too. There may be a gradient point on the shoulder of the paper worth going to. I've seen recommended values targeting a fixed 0.9x the max density of the paper.

Gotta have a fixed point option though, even for me - because I'd want to see it from all angles.

Bill Burk
 

Photo Engineer

Subscriber
Joined
Apr 19, 2005
Messages
29,018
Location
Rochester, NY
Format
Multi Format
David;

Any exposure on the toe or shoulder is not desirable. The ISO value, ideally, should be the lowest exposure that places the scene entirely on the straight line portion of the curve. As it turns out though, due to the way it is done in practice giving a safety factor, the exposure is about 1 stop more, moving the scene up the curve to higher density. This results from the newer emulsions and the sharper toes of modern films compared to older films.

So, as a result, any discussion so far has been wide of the mark when it comes to actual practice in the design of a film and choosing the ISO value. And, any publication on this prior to the conversion to ISO from ASA or prior to the design of the new films is rather suspect.

PE
 

sanking

Member
Joined
Mar 26, 2003
Messages
5,437
Location
Greenville,
Format
Large Format
David;

Any exposure on the toe or shoulder is not desirable. The ISO value, ideally, should be the lowest exposure that places the scene entirely on the straight line portion of the curve. As it turns out though, due to the way it is done in practice giving a safety factor, the exposure is about 1 stop more, moving the scene up the curve to higher density. This results from the newer emulsions and the sharper toes of modern films compared to older films.

So, as a result, any discussion so far has been wide of the mark when it comes to actual practice in the design of a film and choosing the ISO value. And, any publication on this prior to the conversion to ISO from ASA or prior to the design of the new films is rather suspect.

PE


I agree 100% with PE, i.e. “the ISO value, ideally, should be the lowest exposure that places the scene entirely on the straight line portion of the curve.”

And I also agree with his comment about the newer emulsions and the safety factor. I nearly always expose film incorporating a safety factor of about + one stop. Basically, I base exposure on an incident reading in the deepest shadows where I want detail. If your meter is calibrated and you rate your film at the manufacturer’s ASA rating this will result in overexposure of about one stop, which effectively moves shadow density well into the straight line part of the curve. This is a very safe method that is almost foolproof in terms of a good result.

Development is based on data from BTZS testing and is determined by the subject brightness range between the metered shadow value and a metered highlight reading. The difference is added to SBR 5 (which would be the lowest value possible in practical photography with flat light). For personal interpretation of the scene one may also measure the difference between discreet parts of the scene rather than the entire scene.


Sandy King
 
Last edited by a moderator:

RalphLambrecht

Subscriber
Joined
Sep 19, 2003
Messages
14,706
Location
K,Germany
Format
Medium Format
David

You may try this equation format:

y=(a0+a1*x+a2*x^2)/(b0+b1*x+b2*x^2+b3*x^3)

It returned the following curve for Tmax-400 data for a 16min development at 20C.

y=(2.356E+0-1.641E+0*x+2.908E-1*x^2)/(9.844E-1-1.894E-1*x-1.660E-1*x^2+5.433E-2*x^3)
R^2 = 9.998E-1

As you can tell, it's a very close fit, but that's not surprising with this simple curve shape.

However, the very same equation format returned this equation for MGIV-FB data at grade 2:

y=(2.505E+0+1.724E+0*x-1.137E+0*x^2)/(2.456E+0-8.441E-1*x-1.560E+0*x^2+1.451E+0*x^3)
R^2 = 9.993E-1

This is also a very close fit and easily simulates the characteristic s-shaped curve of paper, which is a bit more complex to fit.

One equation format for film and paper!
 

Photo Engineer

Subscriber
Joined
Apr 19, 2005
Messages
29,018
Location
Rochester, NY
Format
Multi Format
Ralph;

One thing to remember though is that you use the toe and shoulder of the paper, but should not in the case of the film!

PE
 
Joined
Jan 7, 2005
Messages
2,663
Location
Los Angeles
Format
4x5 Format
Steve, Ralph and PE,

With some trepidation, I am stepping back into the discussion. It seems to me that most of the disagreement on this subject comes down to about 1 stop. As I now understand the major film speed methods, they are based on or assume the following (with some approximation):

1. The pre-1960 ASA method was based on a speed point where fg=0.3, and the film speed was calculated such that this point corresponded to an exposure about 5-steps below that indicated by a calibrated meter. (Fig. 8, Nelson, C.N., Safety Factors in Camera Exposures, 1960). The useful luminance range was assumed to go down four stops from the indicated exposure, and the extra stop was considered a safety factor.

2. The revised ASA method included two changes. First, the fg=0.3 criterion was replaced with D=0.1. Testing showed that there was an approximately constant difference between these to points, especially when the negatives were developed to a constant contrast. With an average gradient of ~0.6, the fg=0.3 pt is about 1 stop lower than the D=0.1 point. Simply replacing the fg point with the D point (without changing the calculated ASA speeds) would have meant that the new speed point should be 4 stops below the metered point. At the same time, however, the ASA speeds were doubled, so that the D=0.1 point was now three stops below the indicated exposure. This was done in the belief that the 1-stop safety factor was no longer needed. The net result was that the low end of luminance range (-4 stops) was placed at the old speed point, where fg=0.3 and D is significantly less than 0.1.

3. The Adams Zone System method is designed to place an exposure 4 stops below the indicated exposure (Zone I) at a density of 0.1. Using the relationship between fg=0.3 and D=0.1, this is very close to the *old* ASA method and is expected to give speeds of about half of modern ASA values. From what I gather, this is just about what most people who use the ZS method find. In essence, this brings the speeds back in line with the original ASA method and keeps more contrast in Zone I.

The arguments seem to have to do with whether or not one should try to take advantage of 1 stop of exposure in the toe region or not. I would just point out that the uncertainties in the practical measurements in all of this are substantial, and in practice the results depend on subjective judgments in metering. That could, in itself, be an argument for using the more conservative straight-line approach, but I also appreciate Steve's point that there are trade-offs to increasing exposure. (This is discussed quite clearly in the 1960 Nelson article, but I wonder if these trade off haven't shifted significantly as films have improved so much in the past 50 years.)

David

David,

You've absorbed alot over the last few days since I sent the paper. I just want to make a few quick comments because I don't have time to go into detail. One of the most crucial factors in exposure placement and determination is flare. If I remember correctly, Nelson concluded there existed a two stop safety factor. Currently there is around a stop and most of that is because of flare. I go into more detail later. Without flare, film speeds would be a stop slower than they currently are.

The situation with the ZS is that is was designed before the 1960 change and it never changed.

I think one of the problems with this type of discussion is that people tend to address two seperate issues as if they are one. First you have the determination of film speed, and then you have exposure placement. You probably haven't read the First Excellent Print papers by Jones. I'll also address it in more detail later, but it will help clarify why certain approaches are more desirable than others.

Those tests also showed that there was a range of exposure which maintain high quality results. Many of the limiting factors such as sharpness and grain only come into play with the smaller formats. If shutter speed isn't a critial factor in your shooting, adding some additional exposure is always a good idea. The increased use of the small formats in the 1950s was one of the main reasons for the adjustment in speed values.

My concern isn't the additional exposure, but if you are going to put time into a program or if you just want to have accurate information, there are reasons why the FG and the equivalent ISO methods were chosen and that connects back to the psychophysical testing by Jones which determined which methods most closely produced the best prints. I would guess that no body here has the time or expertise to do that level of research to find a better method. As I've always suggested, a good approach is to use the proven speed methods to have a strong and accurate base, then make any exposure adjustments as desired.

Ron,

I would really like to see some sources and supporting evidence for your claims.

BTW, like I told David earlier, I have a pdf version of Nelson's Safety Factors in Camera Exposure which is the paper that explained the reasoning for the 1960 change. I would be happy to email it to anyone interested. I also will be scanning a wonderful paper on exposure and tone reproduction by Jack Holm and will send that to anyone interest too.
 
Last edited by a moderator:

ic-racer

Member
Joined
Feb 25, 2007
Messages
16,633
Location
USA
Format
Multi Format
David;

Any exposure on the toe or shoulder is not desirable. The ISO value, ideally, should be the lowest exposure that places the scene entirely on the straight line portion of the curve.
PE

You mean your personal EI, not ISO, right? The ISO standard is already set. And, 'ideal' for, as an example, a film manufacturer might be the minimal exposure for an acceptable snapshot (ie highest box speed = higher sale price etc. :smile: ).
 

Photo Engineer

Subscriber
Joined
Apr 19, 2005
Messages
29,018
Location
Rochester, NY
Format
Multi Format
Steven;

I learned this in two ways. The first was practical experience learning from the pros at Cape Canaveral who worked there and also the news photographers and the Nat Geog photographers. I then learned the scientific basis for this in two courses taken internally at Eastman Kodak which effectively "certified" me as a Photo Engineer. We used none of the references you have cited here. We had our own members of the international standards committees who designed the standards come in and give us talks along with their printed course work.

I have published the math behind it which is simple, namely contrast of print = contrast of negative * contrast of paper. The paper is 2.5 (contrast 2) and the film is 0.6 (uncorrected for flare). The print is therefore 1.5. This assumes using the straight line portion of the film and the entire paper curve. Therefore, use of toe or shoulder compresses the data and gives you poorer results, ie loss of data in the highlights and shadows.

The concept is so simple, I did not think that anyone would have problems accepting it. Ralph and Sandy are right on! I agree with them and they agree with me. That simple equation above explains why.

And, BTW, since the slope of the film and paper are the derivatives, the simple equation is able to be sampled point by point to get the contrast of a resultant print to prove everything.

Now, to be sure, you can improve the print by softening the toe and shoulder (but you must not do that to the film). Soft paper toe gives greater highlight detail and I do that in manipulating the toe of my Azo paper. I can do the same to the shoulder, but I'm afraid that the penalty there is poorer blacks so there is less give in the denser regions. If you soften the toe of the paper too much, the dmin comes up. Therefore, in the best of all possible worlds, the film is your constant around which everything else should move.

I overexpose almost all negatives by 1/3 stop.

PE
 

Mahler_one

Member
Joined
Oct 26, 2002
Messages
1,155
I have enjoyed the information presented by the very well informed experts on the current thread.

Might I ask a very simple question? For those of us who are not as mathematically oriented,why not simply use the plotter program as provided by Phil Davis? One does the step wedge procedures for either film or paper, and enters the densitometer readings of each step into the program. In a moment complete curves with the reference points alluded to are produced, ready to be printed or entered into your Palm Pilot. His book( Beyond The Zone System ) presents many of the points discussed above in a manner that is straight forward and easy to understand. Is there anything "wrong" with the methods as presented by the late Mr. Davis? Simply asking for those of us who might not have the time or inclination to read all the references sited. Just curious.
 
Joined
Jan 7, 2005
Messages
2,663
Location
Los Angeles
Format
4x5 Format
Ron,

The question isn't about negative and print matching. I know about film/paper matching as I have shown you examples from my four quadrant reproduction curve program that I wrote. I also know that it isn't a perfect system and that simply matching the film's NDR to the paper's LER doesn't guarantee optiumum results (and I know that because of Jones who established it). It's about subjective tone reproduction. I'm not questioning whether there's better tonal seperation when most of the luminance range is placed on the straight-line portion. I just know that it isn't as rigid of a rule as you are suggesting. I can show you the preferred tone reproduction curve that is produced with the film and paper matching and it isn't straight. And not knowing about the referrences I've used isn't an argument in your favor. I can send you Nelson's paper if you want to read it before you dismiss it out of hand.

Also, my sources tend to have the resulting contrast equal unity, not 1.50. As always, you can continue to treat me like a neophyte if you wish.
 

Photo Engineer

Subscriber
Joined
Apr 19, 2005
Messages
29,018
Location
Rochester, NY
Format
Multi Format
Steven;

The eye integrates an image and supplies a subjective contrast of unity when the mid tone is 1.5 and the toe and shoulder are optimum. A print with a contrast of 1.0 in the mid tones is flat-flat-flat!

The simplest way to measure a film is to just make a stepped exposure at the desired camera shutter speed, or photograph a reflective step scale and then measure film density. You will find that the best results are when the step scale is linear. As for application of this for speed, due to the very poor linearity of older film products the method was open to subjective interpretation, ie "where should I place the exposure if every different spot on the curve is non-linear and therefore gives different results in the overall image?". It was not until the 60s that linear curves (in the mid scale) became common.

Now, Steve, I am speaking as a person who has had to design both film and paper materials from scratch and literally prove the things that I have posted here. I have been able to do this for Ektacolor 37 paper, and for Gold 400 film. I guess that is the only proof I can offer if the simple equation does not satisfy you. I am very sorry.

I might add that many of my comparison tests were done with Ektaprint R using Kodachrome and Ektachrome films and also with Cibachrome. I have some of the comparison prints still with me as I showed in another thread. Most of them are gone, but I can say that quantitative data always accompanied my photo data, and they all adhered to that simple equation in my post above. It is as simple as that!

As for additional proof, I have seen a good bit of Sandy King's work and talked to him 1:1. I respect his work immensely. If he agrees with me and if Ralph does (another person who I respect immensely), those are the highest compliments that I can be given regarding this topic.

Mahler:

You start with a soft toe by adjusting the addition rate of silver to salt to give a broad size frequency distribution curve of grains, and then you add progressively greater amounts of toe suppressing ingredients (called dopants) that increase toe contrast. This changes the shoulder in some cases or the speed, but that is essentially what is done. The chemical that was once used was Cadmium Nitrate.

PE
 

sanking

Member
Joined
Mar 26, 2003
Messages
5,437
Location
Greenville,
Format
Large Format
Ron,

The question isn't about negative and print matching. I know about film/paper matching as I have shown you examples from my four quadrant reproduction curve program that I wrote. I also know that it isn't a perfect system and that simply matching the film's NDR to the paper's LER doesn't guarantee optiumum results (and I know that because of Jones who established it). It's about subjective tone reproduction. I'm not questioning whether there's better tonal seperation when most of the luminance range is placed on the straight-line portion. I just know that it isn't as rigid of a rule as you are suggesting. I can show you the preferred tone reproduction curve that is produced with the film and paper matching and it isn't straight. And not knowing about the referrences I've used isn't an argument in your favor. I can send you Nelson's paper if you want to read it before you dismiss it out of hand.

Also, my sources tend to have the resulting contrast equal unity, not 1.50. As always, you can continue to treat me like a neophyte if you wish.

The thing about input/output values is that they they are objective and easily mapped. Subjective tone reproduction is another issue, and one that falls into the area of art and taste. No matter how valid the studies from the 1960s on the subjective evaluation of tonal values were in their day it is extremely unlikely that people today making the same evaluation would come to the same conclusion for the very simple reason that photography today, and the way people look at photographs, is dramatically different from what it was a half century ago. You see, the plain fact of the matter about art is that it is always subjective, local and transitory.

To give you an example, I was recently reading Ansel Adam's book where he describes the making of forty photographs, covering a period from the 1920s until the early 1980s. What struck me in reading his tex and looking at the images was that his vision and the way he used the technique is specific to the way people viewed photographs in another period. In looking at one example where he explained how he dealt with a high contrast scene I realized that his interpretation would not be acceptable today because we have come to accept the vast potential of image process software to manipulate tonal values.

Sandy King
 
Last edited by a moderator:
Joined
Jan 7, 2005
Messages
2,663
Location
Los Angeles
Format
4x5 Format
I have enjoyed the information presented by the very well informed experts on the current thread.

Might I ask a very simple question? For those of us who are not as mathematically oriented,why not simply use the plotter program as provided by Phil Davis? One does the step wedge procedures for either film or paper, and enters the densitometer readings of each step into the program. In a moment complete curves with the reference points alluded to are produced, ready to be printed or entered into your Palm Pilot. His book( Beyond The Zone System ) presents many of the points discussed above in a manner that is straight forward and easy to understand. Is there anything "wrong" with the methods as presented by the late Mr. Davis? Simply asking for those of us who might not have the time or inclination to read all the references sited. Just curious.

I believe Davis' program uses the ISO parameters to determine the film speed for "normal" processing. You're good there because it has a good correlation between the FG method and the fixed density method at that point. As the film contrast increases or decreases with processing that correlation begins to diverge. For the range in processing that is most commonly used in pictorial photography, the difference in speeds between the two methods isn't very large.

I've attached a Speed/CI curve for a curve family. Both curves come from the same set of data. They only difference is one uses the 0.10 fixed density method and one uses the modern equivalent of the FG method known as the Delta-X Criterion Method. Because the speed point with Delta-X is based on a gradient that is a fraction of the average gradient, it's position tends to move differently than with the fixed density method. Basically, film speeds don't change as quickly with the Delta-X method as with the Fixed density method. Because the differences produced between the two methods, you shouldn't sweat it if you are using the fixed density method, but technically, the fixed density method is not as accurate as Delta-X.

According to Nelson and Simonds in the paper Simple Methods of Approximating the Fractional Gradient Speeds of Photographic Materials, "comparisons are made of the various measures of speed and the print-judgement speeds determined by Jones and Nelson on their original forty films...The delta-X speed correlate as well with the print-judgement speeds as do the speed determined by the .3G fractional gradient criterion." The print-judgement speeds are speeds derived through psychophysical testing and as it relates the method of speed directly with the perception of print quality, it is considered the most accurate way to determine film speeds. The specific testing Nelson is referring to is the First Excellent Print test that he did with Jones.

In Safety Factors in Camera Exposures, Nelson explains that "The fractional-gradient criterion was originally chosen because it has the desirable feature of giving speeds that correlate closely with speeds obtained by practical picture tests." He is also referring to the First Excellent Print test.

If you accept that the FG method best represents practical picture tests, then it has to be regarded as the next best method. So, that would suggest that as the correlation between the Delta-X Criterion and the Fixed Density method diverge with extended or contracted development, it is the speeds resulting from the fixed density method that are becoming less accurate.

Nelson addresses this in Safety Factors. "The fractional-gradient speed criterion (and its approximate equivalent, the simpler ΔX speed criterion) will continue to be useful as a supplement to the fixed-density speed criterion when an evaluation is desired of the effective picture-taking speeds of films that have been developed to average gradients higher or lower than the proposed standard average gradient. The fixed-density criterion tends to underrate films that are developed to a lower average gradient and to overrate films that are developed to a higher average gradient."

In other words, the ISO speed criteria has a correlation to the print judgment speeds only when the ISO parameters are followed. If you want to maintain a close correlation when development differs, you should use the Delta-X criterion.

As with everything else, it's a matter of how far you want to take it, personal
taste, and how anal you want to get.
 

Attachments

  • DeltaX EFS CI - EFS.jpg
    DeltaX EFS CI - EFS.jpg
    52.2 KB · Views: 144
Last edited by a moderator:
Photrio.com contains affiliate links to products. We may receive a commission for purchases made through these links.
To read our full affiliate disclosure statement please click Here.

PHOTRIO PARTNERS EQUALLY FUNDING OUR COMMUNITY:


Ilford ADOX Freestyle Photographic Stearman Press Weldon Color Lab Blue Moon Camera & Machine
Top Bottom