alanrockwood
Member
- Joined
- Oct 11, 2006
- Messages
- 2,198
- Format
- Multi Format
A quick little history.
To find the speed of film researchers Jones, et al 'discovered' that if the shadows fall on a part of the toe curve that is tangent to a line one-third of the slope, that was the minimum exposure for an excellent print. They made multiple prints and showed them to a panel of observers.
When they did this, there were no personal computers and this 1/3 slope or 1/3 G or 'fractional gradiant' was not so easy to find outside of using pencil rulers and paper graph.
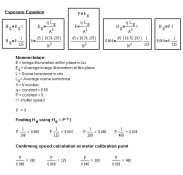
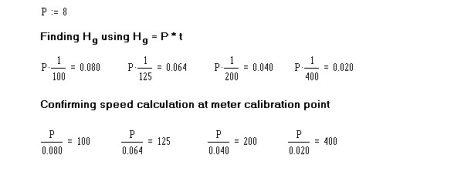
So...three approximations of this 1/3 G (fractional gradient point) were developed that could be found on the toe curve without as much trouble or without a computer:
0.1
Delta-X
W-speed
The three methods were compared and found to be roughly similar in the approximation of 1/3 G speed point.
It turns out 0.1 was eventually chosen as the method to use by modifying it slightly to specify a certain slope the film needs to have (so called 'ASA Triangle') before taking the measurement. This became ASA and was nearly copied directly for the ISO standard and also embraced by many Zone system users.
This whole history of film curve analysis would have probably played out differently had computers been available.
So, as it stands ISO is firmly established, but it is fun to look back at how it came to be.
Realize that in all this research the GOLD STANDARD is "print judgement." Yes, objective viewing of the prints by a panel of observers TRUMPS ALL THE MATH!
View attachment 297328
View attachment 297329
It looks like three of the methods (0.3xGbar, deltaX, and W) are about equally good. The 0.1 method is worse, both in terms of a bias and greater variability.