Double exposure times for high-contrast filters? Not mine.

Shishi

A
Shishi

  • 1
  • 0
  • 35
Near my home (2)

D
Near my home (2)

  • 2
  • 3
  • 111
Not Texas

H
Not Texas

  • 10
  • 2
  • 142
Floating

D
Floating

  • 5
  • 0
  • 59

Recent Classifieds

Forum statistics

Threads
198,549
Messages
2,777,032
Members
99,645
Latest member
MNBob
Recent bookmarks
2

BetterSense

Member
Joined
Aug 16, 2008
Messages
3,151
Location
North Caroli
Format
35mm
I got a full set of Ilford MG under-lens filters recently with no box or instructions. I always heard that for filters above 3.5, you were supposed to double the exposure time. I don't see that at all when I use mine. From right to left, grade 2.5 at 10s, grade 5 at 10s, and grade 5 at 20 seconds.

weird?
 

Attachments

  • contrast.jpg
    contrast.jpg
    95.9 KB · Views: 144

ath

Member
Joined
Aug 29, 2006
Messages
844
Location
Germany
Format
35mm
Ralph is of course right. And additionally every set of filters is designed for a specific paper. Other papers sometimes behave significantly different.
 

pentaxuser

Member
Joined
May 9, 2005
Messages
19,870
Location
Daventry, No
Format
35mm
Based on what the OP has said, it is safe to assume that the filters were secondhand. On the recent Ilford tour I think that Simon Galley hazarded a guess that the filters need replacing every 20 years or so. If the problem is fading of the grade 5 filter, how does he go about ascertaining whether this is the case? Once he establishes whether fading of the grade 5 filter is the problem or not he can then move on to a solution such as replacement or further investigation as to other causes.

I cannot help here as my knowledge is nowhere near good enough but so far I feel that collectively we haven't helped him get much closer to a solution either.

pentaxuser
 

RalphLambrecht

Subscriber
Joined
Sep 19, 2003
Messages
14,637
Location
K,Germany
Format
Medium Format
I think pentaxuser has a point. ic-racer made the point that the filters may have faded. BetterSense needs to do a contrast test for the set of filters in question to see if the contrast does change with each filter. If conducted with a simple step tablet (Stouffer), the actual contrast delivered by each filter and the exposure factor required for a filter can be determined.
 
OP
OP
BetterSense

BetterSense

Member
Joined
Aug 16, 2008
Messages
3,151
Location
North Caroli
Format
35mm
I was using MGIV RC glossy paper of uncertain age. I bought the filters used, and I don't know how old they are. I also got some Kodak variable-contrast filters. In the interest of not wasting paper I would like to test the effects of these filters, but I'm not sure how to proceed. I do have some new MGIV satin paper. I don't have a step wedge, but I have a Kodak Projection Print Scale.
 

RalphLambrecht

Subscriber
Joined
Sep 19, 2003
Messages
14,637
Location
K,Germany
Format
Medium Format
I was using MGIV RC glossy paper of uncertain age. I bought the filters used, and I don't know how old they are. I also got some Kodak variable-contrast filters. In the interest of not wasting paper I would like to test the effects of these filters, but I'm not sure how to proceed. I do have some new MGIV satin paper. I don't have a step wedge, but I have a Kodak Projection Print Scale.

The Kodak Projection Print Scale is not good enough. You either need a step tablet (stouffer) or a timer (an f/stop timer with 1/3 stop increments would work well). Anyway, the step tablet does it all in one exposure, any timer will require multiple exposures, which is frustrating.

I suggest to invest a few $ and call Stouffer. You can use it for many tests, not just this one.
 
OP
OP
BetterSense

BetterSense

Member
Joined
Aug 16, 2008
Messages
3,151
Location
North Caroli
Format
35mm
I have a timer that can do .1s. I suppose I want to make a step exposure from white until black, then try the same regimen with different filters? You're right, that does sound like a lot of work.
 

RalphLambrecht

Subscriber
Joined
Sep 19, 2003
Messages
14,637
Location
K,Germany
Format
Medium Format
I have a timer that can do .1s. I suppose I want to make a step exposure from white until black, then try the same regimen with different filters? You're right, that does sound like a lot of work.

Exactly. The same can be done with one exposure by using a Stouffer step tablet. I suggest to invest in one. It's a small long-time investment with long-time benefits.
 
OP
OP
BetterSense

BetterSense

Member
Joined
Aug 16, 2008
Messages
3,151
Location
North Caroli
Format
35mm
Well I just wasted about 4 decades in the old dark room, printing up a primitive test of my contrast filters, with completely inconclusive results. If you would like to speculate on the results you are welcome to. I think I need to budget a step wedge and in the meantime just figure if it don't print on grade 2, wait.

I printed, from top to bottom, .1, .2, .4, 1, 2, 4, 10, 20, 40, and 80 second exposures. 10 seconds is the first tone that showed up. From left to right, the grade 0, 1, 3, 4, and 5 filters.

wedge.jpg
 

RalphLambrecht

Subscriber
Joined
Sep 19, 2003
Messages
14,637
Location
K,Germany
Format
Medium Format

Nicolas

Thanks for sharing. The ISO standard sets the speed point to 0.6 >b+f. Your data points tell a different story. They are pretty much all over the place. It hard to make out an accurate intersection point. Ilford's own product literature shows a much better fit to the ISO standard. So did (does) the Agfa and Kodak literature, by the way. My own data, also shows little to no deviation from the manufacture data or the standard. I don't know where your deviation comes from, but these are very rough data curves.

The difference might be that I judge the intersection point(s) after applying a best-fit curve through the data points. Best-fit equations for s-shaped curves are not trivial. I can share my empirical equations with you. They were evaluated by Ilford's Technical Department a while back, and they were impressed with how close the data fit was, especially at toe and shoulder. However, I don't think Excel can handle them. You might need a dedicated graphing program.

Different people taken similar measurements often get very different results. Potential sources for variation might be the spectral sensitivity of the densitometer. The red-content in toned or warm-tone papers was too much for my old Agfa densitometer and always gave skewed results. Other issues are often within the consistency of testing. Test exposures should not be collected and then develop together. That alters the results. Just a few thoughts, the list goes on as you probably know. Again, I can't tell where the difference comes from. Maybe you can share how you did your tests in detail.

However, for this conversation it doesn't matter where the speed point is, because it rarely is where we need it to be for an exposure-correction-free contrast change anyway. Nothing beats a well-made test strip.
 

RalphLambrecht

Subscriber
Joined
Sep 19, 2003
Messages
14,637
Location
K,Germany
Format
Medium Format
Ralph,

I presume one can make best use of the Stouffer transmission projection step wedges in conjunction with a densitometer in order to access paper and process characteristics.

Tom.

Yes, Tom

But you can make a lot of use of them without a densitometer too. I can tell you, fr example, what ISO grade your filter/material combination produces with a step tablet and without a densitometer. No sweat!
 

RalphLambrecht

Subscriber
Joined
Sep 19, 2003
Messages
14,637
Location
K,Germany
Format
Medium Format
Well I just wasted about 4 decades in the old dark room, printing up a primitive test of my contrast filters, with completely inconclusive results. If you would like to speculate on the results you are welcome to. I think I need to budget a step wedge and in the meantime just figure if it don't print on grade 2, wait.

I printed, from top to bottom, .1, .2, .4, 1, 2, 4, 10, 20, 40, and 80 second exposures. 10 seconds is the first tone that showed up. From left to right, the grade 0, 1, 3, 4, and 5 filters.

wedge.jpg

I agree, inconclusive. You might need to budget for a new set of filters too.
 

ic-racer

Member
Joined
Feb 25, 2007
Messages
16,533
Location
USA
Format
Multi Format
Maybe its not MG paper? I would think the filters would have all faded the the same pale color to produce those results.
 
OP
OP
BetterSense

BetterSense

Member
Joined
Aug 16, 2008
Messages
3,151
Location
North Caroli
Format
35mm
It was fresh MGIV paper. All were exposed on the same sheet, developed at the same time.
 

Nicholas Lindan

Advertiser
Advertiser
Joined
Sep 2, 2006
Messages
4,237
Location
Cleveland, Ohio
Format
Multi Format
The difference might be that I judge the intersection point(s) after applying a best-fit curve through the data points. Best-fit equations for s-shaped curves are not trivial.

The graphs aren't curve fits, but point-to-point graphs of the average of 3 independent runs. The run-to-run deviations were not large, the reason for the multiplicity was to remove the fliers one gets from operator error, defects in the paper, deviations in surface finish, etc. etc.

I did my master's in curve fitting algorithms and controls for NC machinery. Got a bookcase full of algorithms.

There is no reasonable way to fit VC paper to a curve - the stuff has 3 emulsions so you would need a summation of 3 emulsion curves. Most graded papers seem to be two emulsion VC-like papers - you can see the transition where the first emulsion shoulders out - so even there the situation gets complicated.

I found a power law fit works reasonably well, but the shoulder part of the curve is a bit of a problem. The physics behind the toe, 'linear' and shoulder regions are all different and if you use a function that is the same form as the underlying physics you end up with 3 functions for each emulsion.

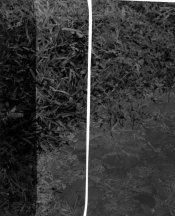
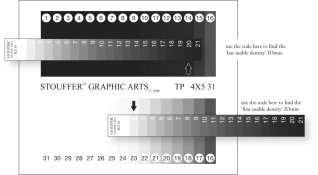
In any case there is no gain in 'smoothing' the data. The deviation from the true curve, whatever it is, to the linear approximation is less than the within-run print to print variation. There is even quite a bit of variation across a sheet of photographic paper. For precision work I find I need to take a serpentine path across the paper to minimize the distance from patch to patch. You can see this in the difference between the densities produced by the two #16 patches on a 31 step tablet.

The manufacturer's data is very prettyfied, has no meaningful scale and is close to useless, though the Ilford curves at least do give an indication of the flat spot in the 00 curve.

The curves supplied on the web site can be trusted. I can read the light on the easel, go to the curve to find the exposure, expose, develop and dry and the density of the resulting print is what the curve indicates it should be.

What is very interesting isn't the HD curve but the derivative of the HD curve - a plot of local contrast. This really reveals the differences between papers and helps in picking the paper that has the right contrast in the right places.

If the equipment used assumes an ideal HD curve then there is no doubt you are going to be doing test strips... Even using the real curves still results in a need for test strips for some prints.

If you don't like ugly curves, then like most of reality, it is best not to look too close.
 

MattKing

Moderator
Moderator
Joined
Apr 24, 2005
Messages
52,708
Location
Delta, BC Canada
Format
Medium Format
If you don't like ugly curves, then like most of reality, it is best not to look too close.

This would make a good website signature - and not just on APUG!

Matt
 

RalphLambrecht

Subscriber
Joined
Sep 19, 2003
Messages
14,637
Location
K,Germany
Format
Medium Format
There is no reasonable way to fit VC paper to a curve - the stuff has 3 emulsions so you would need a summation of 3 emulsion curves. Most graded papers seem to be two emulsion VC-like papers - you can see the transition where the first emulsion shoulders out - so even there the situation gets complicated.

I found a power law fit works reasonably well, but the shoulder part of the curve is a bit of a problem. The physics behind the toe, 'linear' and shoulder regions are all different and if you use a function that is the same form as the underlying physics you end up with 3 functions for each emulsion.

Nicolas

I don't completely agree, because I get very good approximations with all types of photographic materials by using non-linear curve-fitting algorithms of 3rd to 5th order. The following equation was used to fit an ISO grade 4 contrast for MGIV-FB:

y=(3.365E+0+-5.329E+0*x+2.833E+0*x^2+-5.024E-1*x^3)/(3.471E+0+-8.779E+0*x+9.013E+0*x^2+-4.356E+0*x^3+8.218E-1*x^4)
R^2 = 9.999E-1

Feel free to plot this for x-values from 1.0 to 2.0 to see for yourself. As you can probably tell, I used the following equation format:

y=(a0+a1*x+a2*x^2+a3*x^3)/(b0+b1*x+b2*x^2+b3*x^3+b4*x^4)

Unfortunately, this is not helping the original question, but I'm very interested to continue this conversation via private eMails, if you like.
 

RalphLambrecht

Subscriber
Joined
Sep 19, 2003
Messages
14,637
Location
K,Germany
Format
Medium Format
Don't worry about drifting the thread. It's not a problem at all.

Just so you know what you need and get, I attached two files. The first shows the step tablets you need, and how to use them. This will allow you to measure the exposure difference from highlight to shadows needed for each filter. You also need a table to turn the exposure differences into ISO contrast. That's what the 2nd attachment is for.
 

Attachments

  • StoufferTP4x5-IDmin-max.jpg
    StoufferTP4x5-IDmin-max.jpg
    66.1 KB · Views: 96
  • StdPaperGrades0.jpg
    StdPaperGrades0.jpg
    30 KB · Views: 93
Photrio.com contains affiliate links to products. We may receive a commission for purchases made through these links.
To read our full affiliate disclosure statement please click Here.

PHOTRIO PARTNERS EQUALLY FUNDING OUR COMMUNITY:


Ilford ADOX Freestyle Photographic Stearman Press Weldon Color Lab Blue Moon Camera & Machine
Top Bottom