• Welcome to Photrio!
    Registration is fast and free. Join today to unlock search, see fewer ads, and access all forum features.
    Click here to sign up

Comparing Spectral Sensitivity Curves?

Barney's Bargain Shop

A
Barney's Bargain Shop

  • 0
  • 0
  • 0
Coburg Street

A
Coburg Street

  • 1
  • 1
  • 62

Recent Classifieds

Forum statistics

Threads
201,738
Messages
2,829,391
Members
100,923
Latest member
GB-A2
Recent bookmarks
0

TimVermont

Member
Allowing Ads
Joined
Mar 8, 2005
Messages
468
Location
Boston
Format
Multi Format
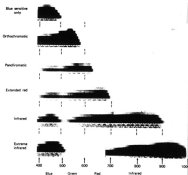
Can spectral sensitivity curves be used to predict a film's response to filtration, or are there too many other factors in play? As a practical example if one wished to find a currently available film with the same response to filters in daylight as the now deceased Agfa APX 25?
 

Kirk Keyes

Member
Allowing Ads
Joined
Jun 17, 2004
Messages
3,234
Location
Portland, OR
Format
4x5 Format
The only catch is that it's rare that any two film manufacturers use the same format when graphing, and they often use differing color temps of the light source. You can correct for all that if you're good with math, but it's a bitch...
 

AgX

Member
Allowing Ads
Joined
Apr 5, 2007
Messages
29,972
Location
Germany
Format
Multi Format
To be more precise, here are

three examples:

-) Kodak current graphics are the most precice stating: wavelenght, energy per density and the the aim density itself (0.3 and 1 above base&fog)

-) Agfa is next with another energy unit though. (But it does not state the aim density in some graphics, the others are 1 above base&fog)

-) IlfordPhoto is worst giving just a `wedge spektrogram´ . Here not even the energy spread over the spectrum is stated.
 

df cardwell

Member
Allowing Ads
Joined
Jul 16, 2005
Messages
3,358
Location
KY USA
Format
Multi Format
Using Kodak's info as a guide,
and a Macbeth color chart as a subject,
start with you favorite film:

shoot the chart, make a perfect negative with no filtration.
print it BRACKET +/- 4 stops

using that exposure and development as a starting place,
shoot the chart again: use your filters, vary exposure +/- 4 stops
soup, print. DON'T RELY ON A SCAN

results will differ according to the light used for the test.
winter, i'd either use flash indoors
or wait for a nice mild day and run outside

once you have a baseline,
you'll have the data foreever, and can estimate using the spectros from the makers

it takes far less time to do this test than it will take to hear all the opinions of why you shouldn't do it :rolleyes:
 

keithwms

Member
Allowing Ads
Joined
Oct 14, 2006
Messages
6,220
Location
Charlottesvi
Format
Multi Format
Indeed, you need to make sure that the same methods (measurement and plotting) are made when comparing these curves.

I think there was a recent post by Ron asserting that the sensitivity curves could be measured, to a very good approximation, by simply putting a piece of film in a Uv-vis spectrophotometer- a very simple device that many of us lab geeks have and use on a routine basis for other purposes.
 

Photo Engineer

Subscriber
Allowing Ads
Joined
Apr 19, 2005
Messages
29,018
Location
Rochester, NY
Format
Multi Format
Here is another method.

You can expose film or paper to light via a tricolor stepwedge with a WR 98, 99 and 70 filter set. You get what we called a "candy stripe" chart and the number of steps from each filter gives you the spectral distribution. Clunky, but it works.

And, just to clarify matters, the spectral sensitivity to R/G/B is actually proportional to the area under the curve as measured by the wedge spectrogram within the desired wavelengths. Since contrast can vary as a function of wavelength, doing it in units of 10 nm is much too fine and can be misleading - referring back to Kirks comment.

In color materials, there is considerable overlap of sensitivities which makes this difficult but not impossible to do, and with B&W it is best to use the entire curve of a pan material as your working area and not divide it up.

I've included an example of all of the typical types of spectral sensitivities for your amusement. Enjoy.

PE
 

Attachments

  • dye types.jpg
    dye types.jpg
    36 KB · Views: 152
OP
OP
TimVermont

TimVermont

Member
Allowing Ads
Joined
Mar 8, 2005
Messages
468
Location
Boston
Format
Multi Format
Cool, thanks everyone! I think I'll end up with a combination of curve reading and experimentation. Tim
 

nworth

Member
Allowing Ads
Joined
Aug 27, 2005
Messages
2,228
Location
Los Alamos,
Format
Multi Format
Yes, but not very usefully. Real scenes can be quite deceptive. Usually the best route is to bracket exposures until you get used to the filters' behavior with your favorite films. When setting up, look at the scene through the filter and notice what areas are lightened and darkened. Your eyeball, along with experience, can be very useful in determining how to use filters.
 
Photrio.com contains affiliate links to products. We may receive a commission for purchases made through these links.
To read our full affiliate disclosure statement please click Here.

PHOTRIO PARTNERS EQUALLY FUNDING OUR COMMUNITY:


Ilford ADOX Freestyle Photographic Stearman Press Weldon Color Lab Blue Moon Camera & Machine
Top Bottom