

I know this subject has been discussed at length over the years, but I don't think the information has been presented in quite this manner before.
This week I had an opportunity at work to refresh my depth of focus calculations, and in the process created a spreadsheet which allows me to compare depth of focus for several different focal lengths.
With such a spreadsheet, I found myself wondering how the depth of field for longer focal lengths compare to 50mm f/1.4. So I plugged in some numbers to generate some charts.
Nomenclature:
object space = everything in front of the lens. Depth of field relates to object space.
Image space = everything behind the lens. Depth of focus relates to image space (see the difference?)
Key to understanding the charts:
1) For work I use exact equations, essential for doing actual lens design / optical engineering work. That said, the typical approximation is very close. What is the approximation? From wikipedia:
Note I use "circle of confusion" and "blur circle" interchangeably. Optical engineers use one or the other depending on which lens design school they're from -- Rochester or Tuscon. I didn't go to either so I can use both if I want.
1b) Everybody always argues about what circle of confusion should be defined as. If you understand charts, you'll note that the curves are relative... the actual value used for circle of confusion will just shift everything up or down. The shape of the curves remain the same. If you don't understand charts then, well... I can't really help you. I'm not a math teacher.
1c) I approached circle of confusion in two different ways:
2) The depth of fields are calculated for objects at portrait distances ... i.e. 1-10 meters. The equations then tell you how much object space will be in focus. For example, imaging an object at 2 meters with a 50mm f/1.4 lens will have ~127mm (about 5 inches) in focus... 2.5" in front and 2.5" behind the plane of focus. Btw 1" = 25.4 mm. You should memorize that conversion if you deal with lenses in America.
3) Depth of field is independent of the film format being used. As a linear system, the imaging lens doesn't care what's behind it.
4) I account for bellows factor in the curves (the impact on depth of field was surprisingly small, even as bellows factor has a large effect on working f/#).
5) These are paraxial relationships... which is fine since the type of subjects that you like to shoot with thin DoF are typically at center, but it doesn't account for design aberrations which will cause the DoF to decrease further depending on what specific lens you are using and its wide-open performance.
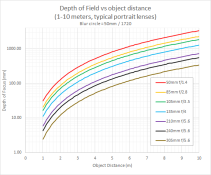
The first chart is a comparison of typical "wide open" f/#'s for different focal lengths that you'll find on 35mm cameras on up to 8x10 format cameras. I wanted to see how the depth of field compares for the different lenses that I use when I'm scanning in negatives. So for this information, I defined all blur circles as 50mm / 1720 = 0.029 um.

For reference, as you stop down a lens, its depth of field curve would shift upward on this chart.
The second chart is for people who print to 8x10 paper. I was answering the question "What f/# should I set my lens to in order to have equivalent depth of field to a 50mm f/1.4 lens?" So for this data, the blur circle is equal to each lens' focal length / 1720. i.e. for a 305mm lens, the blur circle is 0.177 um using Kodak's rule of thumb.
You can see the answer to my question in the legend. The values are mathematically exact (round to two decimal places). In practice you obviously set your lens to the nearest whole stop setting.

I can slice the data a bunch of different ways, but this is how I sliced it to answer the questions I had on my mind. In particular I was digging into why it seems all the old 6x9 folders out there had 105mm f/3.5 lenses but never really much faster. Well... makes perfect sense now looking at this chart.
The numbers are all in metric because lens designers work in metric, and as mentioned these charts were for real work. Which is also why you know this is good information.
The horizontal axis is distance to your object (technically from the entrance pupil) in meters. 1 meter ~ 1 yard so there you go. The vertical axis is the total range of distances (millimeters) that are in focus ... "in focus" defined as less blurring than what you care about .. i.e. your circle of confusion or blur circle. ~25mm = 1 inch. The vertical axis is a logarithmic scale.
So for example at 3m object distance, if the curve shows a 300mm depth of field, then everything at a distance of 3 + / - 0.150 meters is in focus.
This week I had an opportunity at work to refresh my depth of focus calculations, and in the process created a spreadsheet which allows me to compare depth of focus for several different focal lengths.
With such a spreadsheet, I found myself wondering how the depth of field for longer focal lengths compare to 50mm f/1.4. So I plugged in some numbers to generate some charts.
Nomenclature:
object space = everything in front of the lens. Depth of field relates to object space.
Image space = everything behind the lens. Depth of focus relates to image space (see the difference?)
Key to understanding the charts:
1) For work I use exact equations, essential for doing actual lens design / optical engineering work. That said, the typical approximation is very close. What is the approximation? From wikipedia:
The depth of field can be determined by focal length, distance to subject, the acceptable circle of confusion size, and aperture.[2] The approximate depth of field can be given by:

for a given circle of confusion, C, focal length, f, F-number, N, and distance to subject, u.
Note I use "circle of confusion" and "blur circle" interchangeably. Optical engineers use one or the other depending on which lens design school they're from -- Rochester or Tuscon. I didn't go to either so I can use both if I want.
1b) Everybody always argues about what circle of confusion should be defined as. If you understand charts, you'll note that the curves are relative... the actual value used for circle of confusion will just shift everything up or down. The shape of the curves remain the same. If you don't understand charts then, well... I can't really help you. I'm not a math teacher.
1c) I approached circle of confusion in two different ways:
Set the circle of confusion of all focal lengths equal to 50mm / 1720 (Kodak's rule of thumb). This is what I call the "scanning film" approach... that is, you scan your negatives to take advantage of the greater resolution provided by larger formats than 35mm. So blur circle = 0.029 micrometers for all focal lengths.
set the circle of confusion to the specific focal length / 1720 (Kodak's rule of thumb). This is what I call the "enlarging each negative to an 8x10". So a 35mm negative needs greater resolution to get to an 8x10 print, while an 8x10 negative can be contact printed and so the circle of confusion can be much larger than that of a 35mm. (Think about it for a bit and you'll understand what I'm getting at).
2) The depth of fields are calculated for objects at portrait distances ... i.e. 1-10 meters. The equations then tell you how much object space will be in focus. For example, imaging an object at 2 meters with a 50mm f/1.4 lens will have ~127mm (about 5 inches) in focus... 2.5" in front and 2.5" behind the plane of focus. Btw 1" = 25.4 mm. You should memorize that conversion if you deal with lenses in America.
3) Depth of field is independent of the film format being used. As a linear system, the imaging lens doesn't care what's behind it.
4) I account for bellows factor in the curves (the impact on depth of field was surprisingly small, even as bellows factor has a large effect on working f/#).
5) These are paraxial relationships... which is fine since the type of subjects that you like to shoot with thin DoF are typically at center, but it doesn't account for design aberrations which will cause the DoF to decrease further depending on what specific lens you are using and its wide-open performance.
The first chart is a comparison of typical "wide open" f/#'s for different focal lengths that you'll find on 35mm cameras on up to 8x10 format cameras. I wanted to see how the depth of field compares for the different lenses that I use when I'm scanning in negatives. So for this information, I defined all blur circles as 50mm / 1720 = 0.029 um.
For reference, as you stop down a lens, its depth of field curve would shift upward on this chart.
The second chart is for people who print to 8x10 paper. I was answering the question "What f/# should I set my lens to in order to have equivalent depth of field to a 50mm f/1.4 lens?" So for this data, the blur circle is equal to each lens' focal length / 1720. i.e. for a 305mm lens, the blur circle is 0.177 um using Kodak's rule of thumb.
You can see the answer to my question in the legend. The values are mathematically exact (round to two decimal places). In practice you obviously set your lens to the nearest whole stop setting.
I can slice the data a bunch of different ways, but this is how I sliced it to answer the questions I had on my mind. In particular I was digging into why it seems all the old 6x9 folders out there had 105mm f/3.5 lenses but never really much faster. Well... makes perfect sense now looking at this chart.
The numbers are all in metric because lens designers work in metric, and as mentioned these charts were for real work. Which is also why you know this is good information.
The horizontal axis is distance to your object (technically from the entrance pupil) in meters. 1 meter ~ 1 yard so there you go. The vertical axis is the total range of distances (millimeters) that are in focus ... "in focus" defined as less blurring than what you care about .. i.e. your circle of confusion or blur circle. ~25mm = 1 inch. The vertical axis is a logarithmic scale.
So for example at 3m object distance, if the curve shows a 300mm depth of field, then everything at a distance of 3 + / - 0.150 meters is in focus.
Attachments
Last edited:


