


Stephen Benskin
Member
Average gradient can be a helpful tool. A single number describes the contrast of the film processed at a specific time and how it will respond to exposure. It is a description of the film's exposure input to density output. A collection of these gradient values obtained from a few development tests can be applied again and again to any photographic process, from traditional silver and platinum printing to digital scanning and printing. All that is required is to determine the conditions how the film is to be used, and plug it into a simple equation. Then find the processing time from the film test that produced the required gradient and youre good to go. There is no need to do further film tests if there is a change the printing or shooting conditions. All that is required is recalculate.
There are a number of different techniques and variations used to find a films average gradient. The three principle methods are Gamma, Average Gradient or G Bar, and Contrast Index. The attached article, Contrast Measurement of Black and White Materials, and the attached paper, Contrast Index, discuss the different methods as well as their strengths and weaknesses.
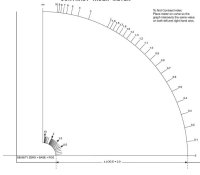
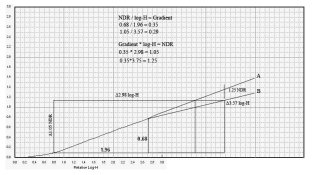
Gamma uses the straight line portion of the film. Fuji and Agfa use Gamma. Ilfords Average Gradient, sometimes written as a capital G with a bar over it, measures 1.50 log-H units from 0.10 Fb+f. And Kodaks CI uses two arcs 2.0 log-H units apart (see attachment).
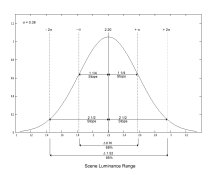
What it all comes down to is which method produces the best results in the greatest number of situations with the greatest number of film types. As each method is an average of the film's gradient, how it averages is key. What part of the film curve should and shouldnt be measured. For example, would the gradient obtained from measuring the curve from the lowest point on the toe to high up into the shoulder produce an accurate picture of the film because it is representative of the whole range of the film curve or would measuring an area that isnt going to be used in most shooting situations produce unrealistic results?
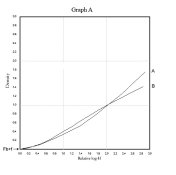
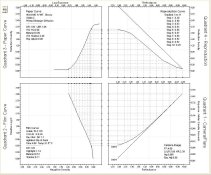
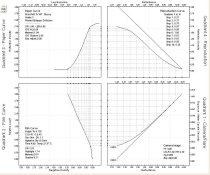
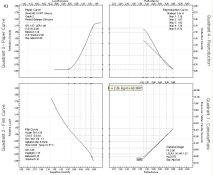
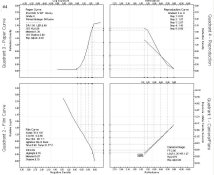
The attached Graph A is of two film curves a long toed curve (A) and a medium toed curve (B). The point where each of the films is measured will produce a different value. My programs use two different methods automatically and has an option for a third. According to a variation of the Contrast Index method that I use, the two curves in Graph A have identical CIs.
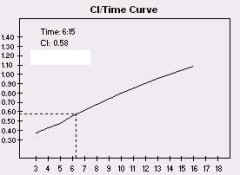
Graph B shows a number of the different methods, including the Zone Systems Negative Density Range method.
So what would be the best method and why? Is there one? Does each method work equally well at different levels of contrast? What are the factors that must be considered?
There are a number of different techniques and variations used to find a films average gradient. The three principle methods are Gamma, Average Gradient or G Bar, and Contrast Index. The attached article, Contrast Measurement of Black and White Materials, and the attached paper, Contrast Index, discuss the different methods as well as their strengths and weaknesses.
Gamma uses the straight line portion of the film. Fuji and Agfa use Gamma. Ilfords Average Gradient, sometimes written as a capital G with a bar over it, measures 1.50 log-H units from 0.10 Fb+f. And Kodaks CI uses two arcs 2.0 log-H units apart (see attachment).
What it all comes down to is which method produces the best results in the greatest number of situations with the greatest number of film types. As each method is an average of the film's gradient, how it averages is key. What part of the film curve should and shouldnt be measured. For example, would the gradient obtained from measuring the curve from the lowest point on the toe to high up into the shoulder produce an accurate picture of the film because it is representative of the whole range of the film curve or would measuring an area that isnt going to be used in most shooting situations produce unrealistic results?
The attached Graph A is of two film curves a long toed curve (A) and a medium toed curve (B). The point where each of the films is measured will produce a different value. My programs use two different methods automatically and has an option for a third. According to a variation of the Contrast Index method that I use, the two curves in Graph A have identical CIs.
Graph B shows a number of the different methods, including the Zone Systems Negative Density Range method.
So what would be the best method and why? Is there one? Does each method work equally well at different levels of contrast? What are the factors that must be considered?