Algorithm/Numerical Approach for Computing CI (Contrast Index)

Couples

A
Couples

  • 0
  • 0
  • 8
Exhibition Card

A
Exhibition Card

  • 2
  • 0
  • 50
Flying Lady

A
Flying Lady

  • 5
  • 1
  • 79
Wren

D
Wren

  • 1
  • 0
  • 47

Recent Classifieds

Forum statistics

Threads
199,038
Messages
2,785,123
Members
99,787
Latest member
jesudel
Recent bookmarks
0

dpgoldenberg

Member
Joined
Feb 18, 2009
Messages
50
Format
Med. Format RF
Rafal,
I'm glad to hear that my suggestions were helpful and that you were able to implement them in R. You might want to try fitting your data to the function I suggested in the earlier thread:

D(x) = a1*ln(1+exp(a2*x + a3))
where D is density, x is exposure (on a logarithmic scale) and a1,a2, a3 are constants. ln is the natural logarithm and exp is the number e raised to the power in the parentheses.

I didn't realize it when I first suggested this function, but I later discovered that it had been introduced for sensitometry in 1920s by Robert Luther, a Professor at the University of Dresden. Over the years, it was found to work remarkably well for lots of film-developer combinations, except for the shoulder region, where it is not applicable at all. There is also a bit of theoretical basis to justify its use.

David
 
OP
OP
Rafal Lukawiecki
Joined
Feb 23, 2006
Messages
789
Location
Wicklow, Ireland
Format
Multi Format
Splines are commonly used to describe arbitrarily curved shapes, because they can be made to fit almost any point set with a smooth looking curve. In the same fashion you can make them LMS fit a point cloud, and that's what you did with your LOESS approach, or to say it more accurately: that's what the LOESS algorithm did for you. The more degrees of freedom you allow the LOESS algorithm, the closer the result will fit your point cloud, but remember that your point cloud is still noisy data!

Rudi, you make a very good point, and I have no doubt that spending more time writing code that would fit a more correct curve, which follows the log relationship which you, and David, have mentioned, would be a better way to get accuracy. However, my original goal was to calculate the CI in a more automated way than what I did previously using graph paper, having picked the technique from Bill (thanks!). When doing it by hand, I already had to create a "spline" by rotating the French curve (Bezier) two or three times, as I was drawing a smooth line through my points plotted off the densitometer. Then I was using the CI-ruler to approximately find the 3 points that met the condition. I have a feeling that the Bezier spline approximation, calculated in my code, does as good, or perhaps even a better job that what I did by hand. Perhaps you have a set of logE/D points for which you know their CI, that we could use to further test my code? I wonder how much more (useful) precision would I gain by finding a better, more "film-like" log-based smoother.

Rafal,
I'm glad to hear that my suggestions were helpful and that you were able to implement them in R. You might want to try fitting your data to the function I suggested in the earlier thread:

D(x) = a1*ln(1+exp(a2*x + a3))
where D is density, x is exposure (on a logarithmic scale) and a1,a2, a3 are constants. ln is the natural logarithm and exp is the number e raised to the power in the parentheses.

Many thanks, David and Rudi, for your suggestions—I wonder what would be able to cope with a touch of shouldering, should it be present. I will use them the next time I have a chance to spend a day coding film-testing utilities.
 

Rudeofus

Member
Joined
Aug 13, 2009
Messages
5,081
Location
EU
Format
Medium Format
Tat's rather complicated.that's ehy I use a simple average gradient as phil davies shows in his book''Beyond the ZO
ZONESystem'.Tha's all you needin my opinion.

The question is how much information you can extract from a limited and noisy set of data points. If advanced methods and modern computing give you results that are much more statistically sound and are therefore much more accurate and reliable, why wouldn't you want to use them? Not everybody is scared to death by math ...
 

Rudeofus

Member
Joined
Aug 13, 2009
Messages
5,081
Location
EU
Format
Medium Format
I wonder what would be able to cope with a touch of shouldering, should it be present. I will use them the next time I have a chance to spend a day coding film-testing utilities.
If you look at my two model functions, the second one should be able to cope very well with shouldering with negative values for b.
 

dpgoldenberg

Member
Joined
Feb 18, 2009
Messages
50
Format
Med. Format RF
Many thanks, David and Rudi, for your suggestions—I wonder what would be able to cope with a touch of shouldering, should it be present. I will use them the next time I have a chance to spend a day coding film-testing utilities.

Rafal,
Here is another function that does include a shoulder:

f(x) = a1*log(1+exp(a2*x+a3))/(a4+log(1+exp(a2*x+a3)))

This is based on my original function for the toe and linear regions, but then modifies the result of that function by a rectangular hyperbolic function to form the shoulder at the larger values. I suggested this in the mega-thread on curve fitting. Here is a link to an image showing a fit of this function to a set of data for enlarging paper that Ralph Lambrecht provided.

(there was a url link here which no longer exists)

David
 

Rudeofus

Member
Joined
Aug 13, 2009
Messages
5,081
Location
EU
Format
Medium Format
Here is another function that does include a shoulder:

f(x) = a1*log(1+exp(a2*x+a3))/(a4+log(1+exp(a2*x+a3)))
David, your curve implies that the shoulder is as abrupt as the toe, which is generally not the case. It also requires that you catch the complete shoulder region with your measurement data points or you risk numerical instability in your curve fit.

For these reasons I strongly advise against this model and recommend you take another look at my square model.
 
OP
OP
Rafal Lukawiecki
Joined
Feb 23, 2006
Messages
789
Location
Wicklow, Ireland
Format
Multi Format
CI Calculator Now Plots Dev/CI Chart and New Delta 100 DDX Charts

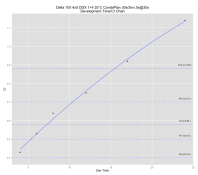
Following Bill's suggestion, I have added a Development Time/CI plot. It highlights, with horizontal lines, the CIs I would presently associate with different N-times. If your CI-N relationship is different, and if you use my R code, you can just pass those as a parameter, it is explained in the comments in the file.
Delta 100 4x5 DDX 1+4 Dev Time-CI-N.png
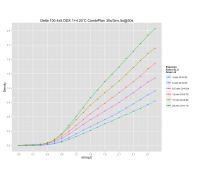
As for real darkroom stuff, I have just run another test, at 4 min in DDX 1+4, to get the lowest contrast curve, which I was missing earlier. This is what my Delta 100 seems to be doing, I wonder how different it may be from others on the forum (I've only seen Michael 1974's plots):
Delta 100 4x5 DDX 1+4 4-24 min.png
 

Attachments

  • CI_Dev_Plotter.R.txt
    9.5 KB · Views: 119
OP
OP
Rafal Lukawiecki
Joined
Feb 23, 2006
Messages
789
Location
Wicklow, Ireland
Format
Multi Format
For those following this thread, I have updated and posted all the R code behind this project on GitHub, as that way I can keep it fresh and relevant. Feel free to comment here or there, and any updates, forks etc are welcome. Find my characteristic curve plotter (and also a Zone System dev time calculator and VCCE calibrator) at:

https://github.com/RafalLukawiecki/film_tests
 
Photrio.com contains affiliate links to products. We may receive a commission for purchases made through these links.
To read our full affiliate disclosure statement please click Here.

PHOTRIO PARTNERS EQUALLY FUNDING OUR COMMUNITY:


Ilford ADOX Freestyle Photographic Stearman Press Weldon Color Lab Blue Moon Camera & Machine
Top Bottom