


Rafal Lukawiecki
Member
Recently I've been plotting my film test curves using R (sorry Bill), which I also use for smoothing them. I can calculate a myriad of gradients by getting a linear regression of any section of the fitted smooth curves, but I would like to code a procedure for calculating CI. I have used the hand-held technique, using the CI "ruler" with points marked off at 0.2 and 2.2 log E, and I think I understand the concept of the two concentric arcs described (there was a url link here which no longer exists). I have also seen discussions about automating curve-related plotting in several threads:
What I would like to ask for, please, is a pointer towards a suitable algorithm to use the just found curve to calculate the CI. I assume no weird curve shapes, and generally good inputs. If nothing can be found, then I will be resigned to writing a short loop, that "walks" the curve looking for the intersection of the 3 points on a straight line, first at x=FB+F, the other distant 0.2 and lying on the curve and the third, distant from the first 2.2, and also on the curve. But I am sure someone must have already coded that in a more elegant way than just doing a brute search along the curve.
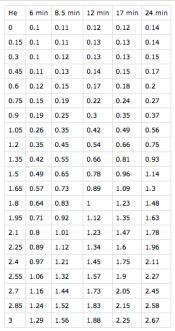
FYI, example of plots, I'd be happy to share the few lines of R code if anyone cares:


Many thanks.
- Film Curve Plotting: (there was a url link here which no longer exists)
- Algorithm for Curve Characteristics: (there was a url link here which no longer exists)
- Calculating CI: (there was a url link here which no longer exists)
What I would like to ask for, please, is a pointer towards a suitable algorithm to use the just found curve to calculate the CI. I assume no weird curve shapes, and generally good inputs. If nothing can be found, then I will be resigned to writing a short loop, that "walks" the curve looking for the intersection of the 3 points on a straight line, first at x=FB+F, the other distant 0.2 and lying on the curve and the third, distant from the first 2.2, and also on the curve. But I am sure someone must have already coded that in a more elegant way than just doing a brute search along the curve.
FYI, example of plots, I'd be happy to share the few lines of R code if anyone cares:
Many thanks.