aconbere
Subscriber
Hi all,
I'm having some struggles getting started with ink profiles and QTR. I've been making digital negatives for a while, but this is my first time trying to set up a process in my own home with my own printers (and it’s all making me feel exceptionally dumb! ).
).
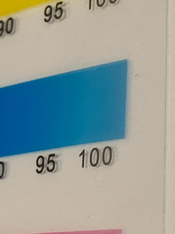
I've made an inkjet print (on an Epson P5370 using the Premium Luster 260 paper profile) of the ink separation image to begin making an ink profile for UV printing. When I print it at 100% ink density I get marking in the densest portions of the image (90-100%).
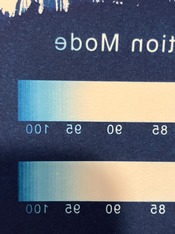
When I print the separation image at 70% ink limit everything is grand (but the whites aren’t quite white).
I believe what’s happened here is I’ve saturated the fixxons and the marking is the print head running through the puddle. But I’m unsure.
What if anything should I do about this? I think I can continue building a profile with the instructions I have but I’m not super confident.
Any guidance would be appreciated!
I'm having some struggles getting started with ink profiles and QTR. I've been making digital negatives for a while, but this is my first time trying to set up a process in my own home with my own printers (and it’s all making me feel exceptionally dumb!
).I've made an inkjet print (on an Epson P5370 using the Premium Luster 260 paper profile) of the ink separation image to begin making an ink profile for UV printing. When I print it at 100% ink density I get marking in the densest portions of the image (90-100%).
When I print the separation image at 70% ink limit everything is grand (but the whites aren’t quite white).
I believe what’s happened here is I’ve saturated the fixxons and the marking is the print head running through the puddle. But I’m unsure.
What if anything should I do about this? I think I can continue building a profile with the instructions I have but I’m not super confident.
Any guidance would be appreciated!