Multigrade Paper HD Curves

Roses

A
Roses

  • 1
  • 0
  • 44
Rebel

A
Rebel

  • 3
  • 1
  • 58
Watch That First Step

A
Watch That First Step

  • 1
  • 0
  • 53
Barn Curves

A
Barn Curves

  • 2
  • 1
  • 47
Columbus Architectural Detail

A
Columbus Architectural Detail

  • 4
  • 2
  • 50

Forum statistics

Threads
197,488
Messages
2,759,829
Members
99,515
Latest member
falc
Recent bookmarks
0

distributed

Member
Joined
Sep 11, 2020
Messages
127
Location
Switzerland
Format
Multi Format
I am currently trying to investigate the behavior of multigrade papers under different illuminations. Based on the Ilford document at [1] I believe that pure blue or green exposure produces HD curves with steep and less steep gradients.

When I illuminate the paper with both blue and green light, I would expect to see a combination of the two characteristic curves of pure blue/green illumination, of course capping out at DMax and the with curves shifted according to the respective exposure. More specifically, to the left of the combined HD curve I expect to see the flatter HD curve of the green illumination. At a certain exposure, the toe of the blue curve sets in, increasing the slope considerably until the curve reaches the shoulder. In other words, between toe and shoulder of the resultant curves I expect to see two straight line segment with first a low and then a higher slope.

Looking at a comparison between the old and new Ilford multigrade papers[2] (page 3) it seems like the old version might show something of a two segment behavior. It's kinda hard to tell though as the graph with grades 00-3 is cramped to the point of being useless. I cannot make out this two segment behavior in the graphs for the new papers.

Now to my question: Do multigrade papers generally show the two-segment behavior detailed above? If not, what am I missing?

[1] https://www.ilfordphoto.com/wp/wp-content/uploads/2017/03/Contrast-control-for-Ilford-Multigrade.pdf
[2] https://www.ilfordphoto.com/amfile/file/download/file/1954/product/745/
 

138S

Member
Joined
Dec 4, 2019
Messages
1,776
Location
Pyrenees
Format
Large Format
it seems like the old version might show something of a two segment behavior.

Of course, the document you linked says:

SP32-20200917-172559.jpg


These are the two segments you mention in the older paper...


For the new RC paper the second doc you linked says:

SP32-20200917-172921.jpg


So with the new paper you don't have the two segments...

In general the contrasty grades are more difficult to expose with precision, so it was good that the higher grades were made slower (less sensitive) to have more accuracy, so ilford formulated the paper to make 4, 4.5 and 5 grades aproximately requiring double exposure, but one has to remember to double that exposure when increasing grade beyond 3.5.

New RC version is more simple to expose, but high grades can be a bit too fast.

A usual situation is that you make the general exposure with a grade that is under 4, they you may burn certain shadow areas with grade 5. With the new paper when you burn in the shadows (with grade 5) you have to work faster to conserve detail, still you may electronically decrease the illumination to have more time to do the job.

_______________________

When you increase the grade highlights conserve a similar result (with the old paper you double exposure from 4 grade and up), but all the rest becomes "proportionally" darker.

A popular way to adjust exñosure+contrast is adjusting exposure for the highlights and when highlights are OK you increase the Grade until the shadows and mids are dense enough.

With split grade you may adjust the highlights by adjusting the green exposure, and you adjust the shadows by adjusting the blue exposure.

______________________


Note that Yellow exposure is the same than Green exposure, Yellow is green plus red and red does nothing. In the same way blue and magenta does the same, as magenta is blue with red. Paper is not much sensitive to red.


______________________

Always read datasheets with a magnifier glass, as many times as necessary. Datasheets may contain some commercial promotion but they also contain high value information !!

______________________

Get an Stouffer T2115 density wedge and make contact prints of it with different grades (conserving exposure, compensated with old paper) to see what happens.

I'd recommend you Beyond The Zone System book, to learn film and paper calibrations
 
Last edited:

MattKing

Moderator
Moderator
Joined
Apr 24, 2005
Messages
51,946
Location
Delta, BC Canada
Format
Medium Format

ic-racer

Member
Joined
Feb 25, 2007
Messages
16,484
Location
USA
Format
Multi Format
Reflection densitometery is more challenging than transmission, as the paper surface and light source of the densitometer can have a big influence on the findings. I'd say that is why there is not as much discussion of paper curves here; poor repeatability between forum users.
Having posted that, you still might want to source a reflection densitometer and check how the paper responds in your darkroom.
 

grainyvision

Subscriber
Joined
Feb 19, 2018
Messages
695
Location
Denver, Colorado
Format
Multi Format
One thing often unappreciated with multigrade filtration is that the two different emulsions typically (on all VC papers) behave similarly in regards to highlights (ie, shadow speed if it were treated as a negative) but will build up to dmax much quicker for the high contrast emulsion. There are a few papers I've seen with actual variable "shadow" speed but this tends to be minimal, probably due to the practical difficulties of working with such a material (ie, radical changes to exposure with filtration changes) while also being more difficult to produce both grade 00 and 5 contrast response.
 
OP
OP

distributed

Member
Joined
Sep 11, 2020
Messages
127
Location
Switzerland
Format
Multi Format
I did not know this paper by Nicholas O. Lindan. It is a very good read, thank you very much!

It answers my question, the segmented behavior can be seen on the curves of page 5 or even better the local gamma curve on page 7. Snooping around on the Darkroom Automation webpage, I found [1] which contains a number of HD curves plotted over the filter range, like [2]. This is most helpful information and corroborates the theoretical results.

I have a darkroom at home, without a reflection densitometer. There's one at a my communal shared darkroom that I can access. I did some test strips at home to characterize a DIY LED light source that I am hacking into my enlarger at home. I then took the test strips to the shared darkroom to measure density. It works, but turnaround time is pretty high. If I were to just use the Heiland head at the shared darkroom, I could get around this, though.

@138S: I think there is a misunderstanding. I am speaking about segmented HD curves, not about the jump in speed when switching between filters. Looking at the Lindan paper mentioned above, you can see the segmention on the plots for filters for #2 ond #3.5 on page 5. The graph for #2 has a change in gradient at about log exposure ~ -1.5 where the Cyan+Blue and Blue emulsions have their toes. In the #3.5 graph, said point is at about ~ -1.7.

You raise an interesting point about exposure accuracy for the higher grades, thank you. As I am building my own illumination I can adjust the power of the blue and green channels individually. I was already thinking about reducing blue power with respect to green as I expect blue exposure times to be laughably short in contrast to green times. This would make dodging in the hard exposure basically impossible, adjusting blue power will ease the problem.

I am also thinking about buying a step wedge, because it is very fast and convenient to use. Currently I am doing test strips by controlling exposure and masking test strip parts not to be exposed. As I am switching LEDs with a microcontroller, it's safe to assume that I achieve high timing accuracy.

@earlz: Do you mean that the toe sections for illumination with blue/green look similar? Do you mean that using soft/fast filtration you get the toe point at basically the same exposure time?


[1] http://www.darkroomautomation.com/support/
[2] http://www.darkroomautomation.com/support/mgivrchd.jpg
 

ic-racer

Member
Joined
Feb 25, 2007
Messages
16,484
Location
USA
Format
Multi Format
Step wedges are pretty inexpensive. If you have access to a transmission densitometer, you can buy an uncalibrated step wedge and measure the steps yourself.
 

138S

Member
Joined
Dec 4, 2019
Messages
1,776
Location
Pyrenees
Format
Large Format
I am also thinking about buying a step wedge,

This is a great tool that's useful a lot...

As I am switching LEDs with a microcontroller, it's safe to assume that I achieve high timing accuracy.

Problem is not the accuracy in the exposure time, but in the print manipulation. After making the general exposure you may want to burn certain shadows with 5 grade and certain highlights with grade 00. With the new paper we have half of the time (than with old paper) to burn the shadows with grade 5, so we may require to trim the illumination power to spend the right amount of time in the burning. We always may adjust the general illumination... but too long exposures generate LIRF in the printing of the scene highlights. The new paper changes that balance, simply we should find the way to do the same in a convenient way.
 

138S

Member
Joined
Dec 4, 2019
Messages
1,776
Location
Pyrenees
Format
Large Format
One thing often unappreciated with multigrade filtration is that the two different emulsions typically (on all VC papers)

It can be clarified that VC paper usually has 3 or more different emulsions. More than emulsions they are multiple emulsion components mixed to coat a single sensitive layer, but some papers have more than one sensitive layer.

In particular that famous ilford paper cites 3 emulsions. https://www.ilfordphoto.com/wp/wp-content/uploads/2017/03/Contrast-control-for-Ilford-Multigrade.pdf
 

RalphLambrecht

Subscriber
Joined
Sep 19, 2003
Messages
14,563
Location
K,Germany
Format
Medium Format
I am currently trying to investigate the behavior of multigrade papers under different illuminations. Based on the Ilford document at [1] I believe that pure blue or green exposure produces HD curves with steep and less steep gradients.

When I illuminate the paper with both blue and green light, I would expect to see a combination of the two characteristic curves of pure blue/green illumination, of course capping out at DMax and the with curves shifted according to the respective exposure. More specifically, to the left of the combined HD curve I expect to see the flatter HD curve of the green illumination. At a certain exposure, the toe of the blue curve sets in, increasing the slope considerably until the curve reaches the shoulder. In other words, between toe and shoulder of the resultant curves I expect to see two straight line segment with first a low and then a higher slope.

Looking at a comparison between the old and new Ilford multigrade papers[2] (page 3) it seems like the old version might show something of a two segment behavior. It's kinda hard to tell though as the graph with grades 00-3 is cramped to the point of being useless. I cannot make out this two segment behavior in the graphs for the new papers.

Now to my question: Do multigrade papers generally show the two-segment behavior detailed above? If not, what am I missing?

[1] https://www.ilfordphoto.com/wp/wp-content/uploads/2017/03/Contrast-control-for-Ilford-Multigrade.pdf
[2] https://www.ilfordphoto.com/amfile/file/download/file/1954/product/745/
i'ts a dangerous scientific practice to go into an analysis with a preconceived notion rather than just making the experiment and let the data talk. I believe i't's a common misunderstanding that Ilford Multigrade is coated with two different emulsions on top of each other. From what I remembe3r from talking to Ilford research staff it is one coat of a mixture of two emulsions, which could make a difference In my tests, I've seen the two-segment behavior at some but not all grades.
 

grainyvision

Subscriber
Joined
Feb 19, 2018
Messages
695
Location
Denver, Colorado
Format
Multi Format
@earlz: Do you mean that the toe sections for illumination with blue/green look similar? Do you mean that using soft/fast filtration you get the toe point at basically the same exposure time?

Yes. You can test this yourself using a step wedge of course and just judge by eye. Going from grade 0 to 3 to 5 and keeping exposure the same, you'll pretty much see they have the same response in the highlights (toe in densitometry), with grade 5 sometimes incurring a speed loss on certain papers. The difference between the grades will be in the shadows and how quickly it clips to black. This is variable on the paper. In my experiences:

* Ilford MGV - Always has fairly high contrast highlights (ie, covering a short number of steps) and increasing contrast affects shadows primarily with only minor changing of midpoint.
* Fomatone FB (arista.edu branded) and Fomaspeed RC - Lower contrast highlights than MGV but still fairly high, contrast grades affect the midpoint more as well and react in a more linear way from the midpoints down to darken them
* Adox MC110 - At grade 1 it has about 3 stops more dynamic range than any other paper tested. Much lower highlight contrast than Ilford MGV. Behaves in a more linear way than Foma or Ilford with increasing contrast grade, it actually seems to change the upper midtones some with increasing contrast and is more resistant to clipping shadows to black, but instead darkening them significantly instead and overall moving the scale darker. Highlight speed point still appears unaffected though.
 
OP
OP

distributed

Member
Joined
Sep 11, 2020
Messages
127
Location
Switzerland
Format
Multi Format
Suprisingly, I couldn't find a shop selling transparent step wedges like the Stouffer ones in Switzerland. I will have to order internationally.

Problem is not the accuracy in the exposure time, but in the print manipulation. After making the general exposure you may want to burn certain shadows with 5 grade and certain highlights with grade 00. With the new paper we have half of the time (than with old paper) to burn the shadows with grade 5, so we may require to trim the illumination power to spend the right amount of time in the burning. We always may adjust the general illumination... but too long exposures generate LIRF in the printing of the scene highlights. The new paper changes that balance, simply we should find the way to do the same in a convenient way.

Thank your for the explanation. I see what you mean now. Are there known ballpark numbers for when LIRF becomes noticeable with common papers?

It can be clarified that VC paper usually has 3 or more different emulsions. More than emulsions they are multiple emulsion components mixed to coat a single sensitive layer, but some papers have more than one sensitive layer.

Is it known how many emulsions the new Ilford MG RC Deluxe has?

i'ts a dangerous scientific practice to go into an analysis with a preconceived notion rather than just making the experiment and let the data talk. I believe i't's a common misunderstanding that Ilford Multigrade is coated with two different emulsions on top of each other. From what I remembe3r from talking to Ilford research staff it is one coat of a mixture of two emulsions, which could make a difference In my tests, I've seen the two-segment behavior at some but not all grades.

So far I have measured two HD curves when illuminating with only blue or green light, respectively. I was hoping that using these I would be able to predict an HD curve for a given blue and green mixture. It's very well possible that this is the wrong way to approach the issue. As I have to make round trips to a communal darkroom to quantify my experiments, I was (maybe too) eager to get the most out of the information I have already acquired.

I will carry out measurements based on different ratios of blue/green exposure. Luckily, this thread has already pointed me to a great deal of interesting information that can help me to understand the results :smile:

@earlz: Thank you very much for the explanation!
 

138S

Member
Joined
Dec 4, 2019
Messages
1,776
Location
Pyrenees
Format
Large Format
Are there known ballpark numbers for when LIRF becomes noticeable with common papers?

LIRF becomes soon evident. Say you make a 8" wide prototype print, and you obtain what you want... exposure time was (say) 15". Then you rise the enlarger's head to print 24" wide, if illumination power is the same (same aperture and bulb power) then your new exposure will be 32 (x3 size) so 15x9 = 135 seconds. Of course the print will be quite different, specially in the highlights.

A trick is measuring illumination power on the easel (without the negatine in the carrier) when making the prototype print and later adjusting illumination power after rising the enlarger's head to get the same base power on the easel than when making the prototype, for that you use a luxmeter or a darroom exposure meter.


Is it known how many emulsions the new Ilford MG RC Deluxe has?

I don't know that, manufacturers may not like to disclose much about those manufacturing details, or even they may tell confusing information to misslead competition. ilford developed VC in the WWII times but those papers were not popular until early 1980s, so they are not newcomers in that business. I quess they are able to deliver a good curve by mixing 3 emulsion components with a particular sensitization each, but each component may consist in a mixture of different emulsion batches, who knows...

I theory you make the variable contrast emulsion mixture by mixing a "color blind" emulsion, blue only sensitive (also UV), then you add an ortho emulsion that was sensitized to be also sensitive to green by adding a sensitizing dye (historically erythrosin, for example). Afte the ortho emulsion is washed the exceding erythrosine is mostly eliminated, but some erythrosine remain linked to the sensitized crystals, so in the mix all crystals are blue sensitive but only a share are also green sensitive. You have a VC emulsion yet, but you add a third ortho emulsion that's not totally well green sensitive to obtain a better sensitometric curve. Some manufacturers revealed some details about all that, ilford has that generic paper speaking about 3 components, but how they exactly do it is a bit a secret. Anyway, from our side we only need a quality product and clear information about how it works.
 

bernard_L

Member
Joined
Feb 17, 2008
Messages
1,959
Format
Multi Format
Suprisingly, I couldn't find a shop selling transparent step wedges like the Stouffer ones in Switzerland. I will have to order internationally
  1. Be aware that the log exposure range of paper is significantly less than for a typical negative film. Meaning that the Stouffer wedge with 0.15D steps will deliver a coarse sampling of the logE-D curve of enlarging paper at a middle grade of 2 (even worse at grade 4). So, make sure you order a wedge with 0.10D (or less) steps. I have a T3110.
  2. You might find that the default shipping method by Stouffer is quite expensive. In my case, I exchanged emails and they sent mine via USPS, as a letter, in a padded envelope. The Stouffer staff were nice to deal with.
  3. fotoimpex.de sells the T2115, IMO suitable for film but not for paper as explained above.
  4. See my own measurements of fomabrom variant in
    https://www.photrio.com/forum/threads/comparing-paper-characteristic-curves.171700/#post-2235434
    Nothing like the "flat" step in the middle of the curve as claimed by Lindan for MGIV
Also: technical measurements are a means, not an end...
 

albada

Subscriber
Joined
Apr 10, 2008
Messages
2,175
Location
Escondido, C
Format
35mm RF
Here are contact prints of a Stouffer wedge using the new Ilford Multigrade RC Deluxe paper. Each step is a density-change of 0.15 (i.e., half a stop). Grades are from 00 to 5 (labeled on top of each strip).

TestStripsBulb.jpg


All were exposed using a 250 watt tungsten bulb in a condenser head in a Beseler 45M, configured for 35mm to cover 5x7. The 50mm lens was at f11; exposure was 10 seconds. Developed in Liquidol for one minute. I used Ilford's filter-set.

Two observations:
1. As others have stated, Ilford keeps the high-midtone (low highlight) the same among grades. From my strips, we see that Ilford made the step labeled 8 about the same for grades 00 to 3.
2. Grades 4 and 5 require more exposure to match step 8, as it falls between steps 6 and 7 for grades 4 and 5. Halfway between those half-stops would suggest giving those grades 67% more exposure (the rule for Ilford's earlier papers is 100% more).

Using a light-meter, I measured the transparency/opacity of filters 3-1/2 and 4. Filter 4 passes slightly more light than 3-1/2. I conclude that the required exposure-boost is solely due to the paper, and not due to denser filters.

Mark Overton
 

138S

Member
Joined
Dec 4, 2019
Messages
1,776
Location
Pyrenees
Format
Large Format
It's also due to the light source. Tungsten doesn't have much blue in it. The outcomes when using blue and green leds for instance will be much different.

Of course, the light source has a deep impact, it always happened with cold cathode illuminators that had a missmatch in the grades:

grades.jpg


All depends om how balanced are the green vs blue spectral power distributions. If we substitute the enlarger's tungsten bulb with a LED white bulb then if a warm light one is used (3500k) may make the result more consistent than 5500k one. If our retrofited illuminator is a RGB LED then we may adjust the blue vs green power.
 
Last edited:
OP
OP

distributed

Member
Joined
Sep 11, 2020
Messages
127
Location
Switzerland
Format
Multi Format
@138S:
Wow, this has happened to me and I couldn't quite put my finger on it. I made a test print of size 12x12 cm and when I was happy with it, moved the head up to cover 30x30 cm. I adjusted illumination by a factor (30/12)**2 = 6.25. While the print looked not too far off, the white skirt into which i have invested such dodging effort suddendly just looked... blugh. This looks pretty much like the example you explained to me. Thanks for insight!

@bernard_L:
I suspected the same about the 0.15 steps. Regarding the shipping, do you live in the US or Canada?

Your measurements with Fomabrom Variant in the other thread are most interesting. Thank you for publishing your data on this topic.
 

138S

Member
Joined
Dec 4, 2019
Messages
1,776
Location
Pyrenees
Format
Large Format
@138S:
Wow, this has happened to me and I couldn't quite put my finger on it. I made a test print of size 12x12 cm and when I was happy with it, moved the head up to cover 30x30 cm. I adjusted illumination by a factor (30/12)**2 = 6.25. While the print looked not too far off, the white skirt into which i have invested such dodging effort suddendly just looked... blugh. This looks pretty much like the example you explained to me. Thanks for insight!

I suggested that way to a friend that is a way better printer than me, and he also found it was a very good workflow to go from the prototype size to a big print size if wanting to nail the same result, so at least it was not alone in that opinion, anyway I found that to make the same burning in the big print one also has to adjust the mask height proportionally, to throw the same light, so if the final print is x3 then the height of the (burning) mask over the paper the paper also has to be rised by x3 factor, aproximately, for the same effect if burning the same time.


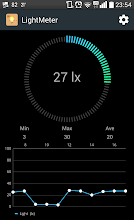
Personally, I use cheap a lux meter to measure light power on the easel, but there are lightmeter apps for the smartphone than may work, they use the sensor in the front face of the phone that measures ambient light in order to adjust screen auto-brightness, if using that way it's better to place that sensor in the very center as this sensor is sensitive to light direction, we may locate the sensor position (at the screen's top) by obscuring it with the finger tip while reading the Lux value.

Those readings are not much real because they depend on direction, but they are perfect for a matching relative measure .


download.png

________________________


Another factor that may make a difference is fall-off, corners may have less fall-off with the small print, as we give more bellows extension the image circle in the film plane grows, so we take more the circle center than with the small large print. This effect is more relevant if the lens in their coverage limits when making the big print, and also it is more relevant with larger apertures, as fall-off decreases when stopping the lens.
 
Photrio.com contains affiliate links to products. We may receive a commission for purchases made through these links.
To read our full affiliate disclosure statement please click Here.

PHOTRIO PARTNERS EQUALLY FUNDING OUR COMMUNITY:


Ilford ADOX Freestyle Photographic Stearman Press Weldon Color Lab Blue Moon Camera & Machine
Top Bottom