... Not exactly sure how to interpret the the x-axis "exposure [log H (lux-seconds)]"
Not too difficult, but as you noticed, important to understand if one wants to interpret manufacturer's data sheets such as this one. Maybe I can help:
Photographic exposure is the product of the illumination and the time of exposure. This can be expressed as:
H = E * t
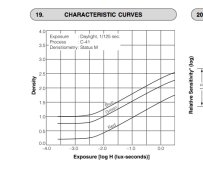
where ‘H’ is the exposure required by the emulsion depending on film sensitivity, ‘E’ is the illuminance, or the light falling on the emulsion, controlled by the lens aperture, and ‘t’ is the exposure time controlled by the shutter. The SI unit for illuminance is lux (lx), and exposure is typically measured in lux-seconds (lx·s).
The exposure shown on the horizontal axis of your sample graph is listed in log units. The log of 1 is '0', which means at x=0 there is an exposure of 1 lx·s and it creates a density of 1.5 on the red layer. A doubling (one f/stop difference) in log is 0.3 (log of 2). Consequently, you know that there is a 10 f/stop difference between '-3' and '0'. According to the current ISO standard for B&W films, finding the exposure required to create 0.1 density above base+fog is used to calculate the film speed:
S = 0.8/H
If this were a B&W film (color films are handled differently), we could agree that at -2.3 lx·s there is about 0.1 density above base+fog and therefore our speed point. Now perform the following calculation:
S = 0.8/10^(-2.3)
to get to an ISO speed of 160.
Hope this helps.