Thanks David that is really awesome. I'm not up on reading the graph, something I guess I should learn I suppose. For my Efke 100 I have it figured out what asa to rate the film at and it corresponding development time all the way from an SBR of 5 to 12. With your wizardry can you come up with something like that??
Oh my! I don't really think that you want to start that discussion. For more than anyone (sane) wants to know, see this recent thread:
(there was a url link here which no longer exists)
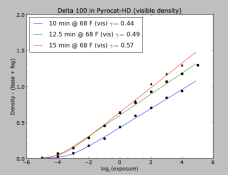
But, here is a bit of explanation of the graph that should help. Log(exposure) = 0 represents the metered exposure off of the surface that I used for the test exposures, with my meter set to EI=100. In zonespeak, that would correspond to Zone V; -4 on the graph is Zone I, and +4 is Zone IX. For the middle curve, a SBR of 9 would lead to negative densities from about 0.05 to 1.15, which I think that most people would consider pretty close to "N". If you want more density (and contrast) in Zone I, you can reduce the EI a bit. (I am leaning towards that, myself). The other curves should give you an idea of how much the contrast changes with development times.
David
P.S. All of this depends on the meter used and the person aiming and reading it. I actually think that this is something that is very hard to pin down and makes a lot of the heated arguments of questionable significance, in my opinion of course.