... how to go about it?
I'd like to make my own version of the Kodak Print projection scale - you know, that transparency/film with a circle (like a "pie chart"), which you put onto paper, then expose for a full minute, and the segments show how long the exposure should be.... Just for fun, I don't expect spectacular results, like doing away with test strips
I thought about printing something on an inkjet printer on transparency material, but got a better idea from a friend who works in graphics industry, and works with professional printers, where they regularly print stuff like that, so he offered to get one printed "professionally"
You might ask why not just purchase one on eboy, but with the recent changes in Customs policies here, it's getting quite expensive to buy even worthless trinkets, as long as they are coming from abroad, so it's not an economical solution. And, since I can get one printed professionally (for free), I say, why not give it a try?
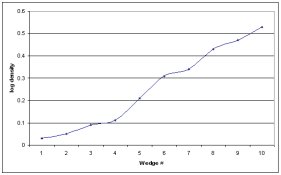
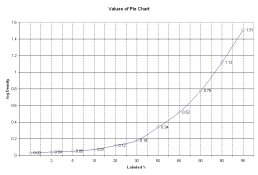
Now, my problem is how to prepare the "pie chart" in a graphics program. I've seen the Kodak print scale in several ebay auctions, and I don't think that the scale is linear - it has ten segments, numbered from 2 to 48 (seconds), with varying opacity. Now, I'm a total idiot when it comes to sensitometry, densitometry, etc., but I don't think that the scale should be linear (i.e. opacity should not progress in 10% opacity steps, but it should be analog to f-stop values, right?). I.e. each next wedge should halve the amount of light passing through...
So, in short - if anyone has an idea on how to reproduce this "print projection scale" in a graphics program, I'd be more than grateful. I was thinking about ten wedges, just like the original Kodak one.
Any ideas?
TIA,
Denis
I'd like to make my own version of the Kodak Print projection scale - you know, that transparency/film with a circle (like a "pie chart"), which you put onto paper, then expose for a full minute, and the segments show how long the exposure should be.... Just for fun, I don't expect spectacular results, like doing away with test strips
I thought about printing something on an inkjet printer on transparency material, but got a better idea from a friend who works in graphics industry, and works with professional printers, where they regularly print stuff like that, so he offered to get one printed "professionally"
You might ask why not just purchase one on eboy, but with the recent changes in Customs policies here, it's getting quite expensive to buy even worthless trinkets, as long as they are coming from abroad, so it's not an economical solution. And, since I can get one printed professionally (for free), I say, why not give it a try?
Now, my problem is how to prepare the "pie chart" in a graphics program. I've seen the Kodak print scale in several ebay auctions, and I don't think that the scale is linear - it has ten segments, numbered from 2 to 48 (seconds), with varying opacity. Now, I'm a total idiot when it comes to sensitometry, densitometry, etc., but I don't think that the scale should be linear (i.e. opacity should not progress in 10% opacity steps, but it should be analog to f-stop values, right?). I.e. each next wedge should halve the amount of light passing through...
So, in short - if anyone has an idea on how to reproduce this "print projection scale" in a graphics program, I'd be more than grateful. I was thinking about ten wedges, just like the original Kodak one.
Any ideas?
TIA,
Denis