digital negative chararistic curves

Table for four.

H
Table for four.

  • 6
  • 0
  • 63
Waiting

A
Waiting

  • 3
  • 0
  • 66
Westpier

A
Westpier

  • 2
  • 2
  • 64
Westpier

A
Westpier

  • 3
  • 0
  • 48
Morning Coffee

A
Morning Coffee

  • 7
  • 0
  • 86

Recent Classifieds

Forum statistics

Threads
197,587
Messages
2,761,516
Members
99,409
Latest member
Skubasteve1234
Recent bookmarks
0

jisner

Member
Joined
Sep 16, 2017
Messages
102
Location
Tucson, Arizona
Format
35mm
I have always heard that digital negatives, unlike analog negatives, are "linear." I would like to understand mathematically what this means. For analog film, transmission density is a function of exposure and development. But digital negatives are not exposed or developed. They are printed. Is printing analogous to exposure and development of film negatives? If so, then "linear" would mean

TD = dR * K

where

TD = transmission density of digital negative
dR = digital negative density range
K = tone in the digital image, where K goes from 0 (white) to 1 (black)​

Unfortunately, this is not the case. If you print a step table on film, make transmission density measurements, and plot them agains K, you get an exponential curve, not a linear one.

So please, someone help me out here. What does it mean when we say a digital negative is linear?
 
OP
OP
jisner

jisner

Member
Joined
Sep 16, 2017
Messages
102
Location
Tucson, Arizona
Format
35mm
an you share the plot you get from measurements?
kMmEqH4xcgAjruGK6


In case the image insert doesn't work, here is a link
 

calebarchie

Subscriber
Joined
Jul 25, 2014
Messages
672
Location
Australia 2680
Format
Hybrid
You need to linearize the output by controlling ink density curves via RIP. Measuring inkjet printed film is shoddy practice anyway (why bother?) better off measuring off your final print - each process/paper/ink combo will require different curves regardless.
 

nmp

Member
Joined
Jan 20, 2005
Messages
1,995
Location
Maryland USA
Format
35mm
kMmEqH4xcgAjruGK6


In case the image insert doesn't work, here is a link

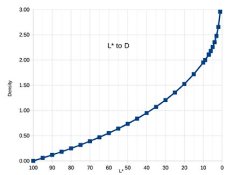
There are a couple of places I think non-linearity is introduced in these measurements. One is the gamma of the image colorspace, for example it is 2.2 for AdobeRGB. This results in a K (or inversely %B of HSB) vs Luminosity (L*) curve that is not diagonal but below it. Secondly, the relationship of the L* (which is what the printer prints against a given black level or a given set of R=G=B values) and the optical density (reflective in case of a print) is not linear. The theoretical L* to D graph looks like this:

L_to_D_Calculations.jpg

If you add those two, you would get something like your plot.

Make sense? or may be we have to think a little more.


:Niranjan.
 
OP
OP
jisner

jisner

Member
Joined
Sep 16, 2017
Messages
102
Location
Tucson, Arizona
Format
35mm
You need to linearize the output by controlling ink density curves via RIP. Measuring inkjet printed film is shoddy practice anyway (why bother?) better off measuring off your final print - each process/paper/ink combo will require different curves regardless.
I should have mentioned that this has nothing to do with printing. I am building a computer model of the tone reproduction cycle (digital image -> negative -> print). In the process of verifying the model experimentally (i.e., making actual measurements), I discovered that my assumption that digital negatives are linear is incorrect. Does the original question make more sense in that context? The model I'm building is only for education. It will not be used to produce curves or anything like that.
 
OP
OP
jisner

jisner

Member
Joined
Sep 16, 2017
Messages
102
Location
Tucson, Arizona
Format
35mm
There are a couple of places I think non-linearity is introduced in these measurements ...
A very helpful answer, thanks. I had already arrived at the conclusion that a gamma was involved, and added a gamma parameter to the model as an "experimental" option (replacing the linear curve by a gamma curve). But frankly, I really didn't know what I was doing! I need to study your answer and will probably have some follow-up questions.
 
OP
OP
jisner

jisner

Member
Joined
Sep 16, 2017
Messages
102
Location
Tucson, Arizona
Format
35mm
The theoretical L* to D graph looks like this:
My model assumes the negative is printed from Photoshop using the standard Epson driver, not QTR. So the driver is working with digital image tones and turning them into densities. I had assumed the printer would produce density in direct proportion to the tone (or perhaps the gamma-corrected tone). I have a simple-minded notion of how Epson printers work, which is a big part of my problem.
 

nmp

Member
Joined
Jan 20, 2005
Messages
1,995
Location
Maryland USA
Format
35mm
My model assumes the negative is printed from Photoshop using the standard Epson driver, not QTR. So the driver is working with digital image tones and turning them into densities. I had assumed the printer would produce density in direct proportion to the tone (or perhaps the gamma-corrected tone). I have a simple-minded notion of how Epson printers work, which is a big part of my problem.

You have to also consider that the output depends on what printer profile you are using. In addition to that, the profile is only good for the reflective color values and not transmission. Is there a predictable relationship between reflective density on say a glossy paper (for which the profile was made) and the transmission density from a transparency - your model will have to take that into consideration. Normally if all that is needed is the final correction curve as we do for making digital negatives, it does not matter what if any printer profile is used as long as the same one is used consistently. But here it would be a factor.

:Niranjan.
 
OP
OP
jisner

jisner

Member
Joined
Sep 16, 2017
Messages
102
Location
Tucson, Arizona
Format
35mm
There are a couple of places I think non-linearity is introduced in these measurements. One is the gamma of the image colorspace,
I made a version of the 11-step grayscale table with a Gray Gamma 1.0 profile. In Photoshop, the image on the screen looks the same as the Gamma 2.2 version, but K values measured with the eyedropper show that B is no longer equal to (1-K):
4zNVmQrhuvrLqpU9A

link: https://photos.app.goo.gl/4zNVmQrhuvrLqpU9A

I printed the Gamma 1.0 negative on film. The K numbers give you an idea of how dark the negative is, compared with the Gamma 2.2 negative. They're practically black by the time you get to B=30%

I measured the steps of the Gamma 1.0 negative using my DIY transmission densitometer. I was able to measure seven densities from B=100% down to B = 40%. The steps below B=30% were too dense to measure. I plotted Density vs Brightness for Gamma 2.2 and Gamma 1.0 on the same graph
Evu8Kz2V1vhRoFSbA

link: https://photos.app.goo.gl/Evu8Kz2V1vhRoFSbA

I'm not claiming my results are conclusive, but here are my tentative conclusions:

(1) The Gamma 1.0 curve is linear in the mathematical sense, that is: equal steps in Brightness produce equal steps in density. In my original post, I wrote this as

TD = dR * K​

which I should have written as

TD = dR * (1-B) + BasePlusFog​

(2) The gamma 2.2 curve is best approximated by a gamma curve

TD = dR* (1-B)^2.2 + BasePlusFog​

Using Desmos, I get curves that fit the data very well using these equations. I had to estimate dR (negative density range, which is the density difference between step B=0% and B=100%) because I could not actually measure the B=0% step. BasePlusFog is simply the density of the B=100% step.

(3) So in what sense is the Gamma 2.2 negative "linear?" It is linear in the sense that human vision perceives it as linear. That is, equal steps in tone are PERCEIVED as being twice as bright.
 

nmp

Member
Joined
Jan 20, 2005
Messages
1,995
Location
Maryland USA
Format
35mm
So in what sense is the Gamma 2.2 negative "linear?" It is linear in the sense that human vision perceives it as linear. That is, equal steps in tone are PERCEIVED as being twice as bright.

A general question/comment while I digest this:

When you say they say digital negative is linear, where did you see this - do you have a source I can look up so I can better understand what is meant by it. It will be good to know the context this claim is made. As I would understand, if I had to make a guess here (and I could be wrong,) linearity is what is introduced in the system by use of a correction curve to counter the non-linearity of the process. (In other words, input values map to same output values (on print) after normalization with respect to the end points.) It is not inherent within the digital negative itself by measurement of transmission densities, particularly since density also is a non-linear function of luminosity as seen on the plot I attached earlier.

:Niranjan.
 
OP
OP
jisner

jisner

Member
Joined
Sep 16, 2017
Messages
102
Location
Tucson, Arizona
Format
35mm
When you say they say digital negative is linear, where did you see this

Google "digital negatives are linear"

You usually hear it in discussions that contrast analog film negatives with digital negatives. It goes like this: "Film negatives have an S-shaped characteristic curve, but a digital negative's characteristic curve is linear." Whether the speaker understands it or not, this statement is only true as long as you understand "linear" to mean "perceptually linear."

linearity is what is introduced in the system by use of a correction curve to counter the non-linearity of the process

I am not concerned with the process or the print, only the negative. A negative printed by Photoshop from a gamma 2.2 grayscale image is perceptually linear. But it will not make a linear print unless you print it with a process having a perfectly linear characteristic curve. Otherwise, an image correction curve must be applied.

Think of it this way: Say you are printing from Photoshop on inkjet paper. If you print an 11-step table in gamma 2.2, the paper print will appear linear to your eyes (the steps will appear equally spaced). But reflection densitometer measurements will show that the print densities are nonlinear because of the gamma. If you print the same step table in gamma 1.0, the print will appear nonlinear to your eyes. But reflection densitometer measurements will show that the print is linear in the mathematical sense (the step densities are equally spaced).

For actual printmaking, none of this is important. It is important to me because I'm building a computer model that simulates tone reproduction, and I need to model how digital negatives map grayscale image tones to transmission densities.
 
Last edited:
OP
OP
jisner

jisner

Member
Joined
Sep 16, 2017
Messages
102
Location
Tucson, Arizona
Format
35mm
...the profile is only good for the reflective color values and not transmission. Is there a predictable relationship between reflective density on say a glossy paper (for which the profile was made) and the transmission density from a transparency - your model will have to take that into consideration.
:Niranjan.
Since the last post to this discussion, I was able to obtain an X-Rite 361T transmission densitometer, which has made it much easier to continue with this experiment. I was able to verify what you say about reflective vs. transmission densities. It's probably not the best way to do it, but to determine the reflective densities of a negative, I printed a 101-step grayscale step table in Adobe RGB. I taped the negative face up onto a sheet of white paper and measured all 101 steps with a Spyder. A plot of reflection density vs. K, I gives a nearly perfect gamma 2.2 curve which only deviates in the lightest tones (this may have something to do with my measurement set-up). I measured transmission densities with the 361T. As you can see in the link below, the transmission densities are poorly approximated by a gamma 2.2 curve.

Reflection densities for a 101-step grayscale step table

The reflective densities increase linearly up to K=50% and then begin to increase rapidly. Based on a single experiment, there's no way to say if the relationship between reflection and transmission is predictable.
 

nmp

Member
Joined
Jan 20, 2005
Messages
1,995
Location
Maryland USA
Format
35mm
The reflective densities increase linearly up to K=50% and then begin to increase rapidly. Based on a single experiment, there's no way to say if the relationship between reflection and transmission is predictable.

Just to make sure, you mean transmission density here and not reflective densities, right?

Is there a way you can do an intensity balance of the incoming light. The presence of the paper in the refection measurement complicates it somewhat. What happens to the measurements if you don't use the backing paper?

Without the paper:

Ir + Ia + It = Io

or

It/Io = 1 - Ir/Io - Ia/Io

Ia/Io will be a constant based on absorbance of the transparency

Ir/Io is some function of K, as measured and modeled

Then It/Io can be calculated as a function of K.

If you include the backing paper, reflective property of the paper as well as 2 absorbances (one for incoming and one for outgoing rays) within the transparency will need to be considered.

Don't know if it makes sense....just thinking out loud.

You have your work cut out for you!


:Niranjan.

 
OP
OP
jisner

jisner

Member
Joined
Sep 16, 2017
Messages
102
Location
Tucson, Arizona
Format
35mm
Just to make sure, you mean transmission density here and not reflective densities, right?
Yes, thanks for catching that.

I am primarily interested in the transmission densities. I measured reflection densities only to see if the reflection curves were different from the transmission curves (they are), so I have no more interested in measuring reflection densities. But just in case I do, can you tell me what the subscripts r, t, a, and o mean? I assume t and r are transmission and reflection.

Today I measured transmission densities of fourteen eleven-step table negatives, each with a different density range. I plotted TD vs. K curves to see if there is a predictable pattern. Here are the plots. I thought I might be able to use one of the curves as a prototype and scale it linearly (by the ratio of the density ranges) to approximate any of the other curves. Bad idea, didn't work. The curves diverge exponentially.
 

nmp

Member
Joined
Jan 20, 2005
Messages
1,995
Location
Maryland USA
Format
35mm
can you tell me what the subscripts r, t, a, and o mean? I assume t and r are transmission and reflection.

Yes. And Io is intensity of the incoming light, Ia is what gets absorbed in the substrate.

What is the parameter B in your latest series of curves?

:Niranjan.
 
OP
OP
jisner

jisner

Member
Joined
Sep 16, 2017
Messages
102
Location
Tucson, Arizona
Format
35mm
Thanks for the information.

What is the parameter B in your latest series of curves?
:Niranjan.

B = (1-K). Rather than labeling the curves B=4, B=6. B=8, ... , B=30, I should have labeled them K=96, ... K=72, K=70, which are the K values of the darkest step (step 11) of each step table. Each of the step tables has a Photoshop curve applied to it, like this.
 

nmp

Member
Joined
Jan 20, 2005
Messages
1,995
Location
Maryland USA
Format
35mm
Thanks for the information.


B = (1-K). Rather than labeling the curves B=4, B=6. B=8, ... , B=30, I should have labeled them K=96, ... K=72, K=70, which are the K values of the darkest step (step 11) of each step table. Each of the step tables has a Photoshop curve applied to it, like this.

Got it. B is how you vary the DR of the negative.

If you have a curve for B=0, shouldn't all other curves be subsets of the that curve? You can interpolate empirically the TD for points on a curve for a given B from the "zero" curve. For example, the DR value for K=1.0 on x-axis for the B=30 curve in your set can be found by drawing a vertical line at K=0.7 (which is the effective K) to intersect the "zero" curve and then drawing a horizontal line from this intersect to the right hand y-axis which would give the max TD for the B=30 curve. The same can be done numerically if the "zero" curve is approximated by curve-fitting with a polynomial

I am not sure I am doing a good job explaining...

:Niranjan.
 
OP
OP
jisner

jisner

Member
Joined
Sep 16, 2017
Messages
102
Location
Tucson, Arizona
Format
35mm
If you have a curve for B=0, shouldn't all other curves be subsets of the that curve?
That is exactly what I had planned to do. But the B=0% curve develops a "shoulder" (so does the B=2% curve), which is kind of analogous to what happens when you overexpose a print. Here is a more detailed view of the B=0% curve, which shows that it falls apart above K=90%.

https://photos.app.goo.gl/EcmhBr9VBh8uzKUJ6

Your suggestion that all curves should be a subset of B=0 is intuitively appealing. It means that any other curve can be obtained by translating the B=0 curve to the right (y = f(x) -> y = f(x-b) and then scaling it back into [0,1]. My modeling software does something like this with process characteristic curves to simulate over- and underexposure of prints. I'm going to try it and let you know how it works out. This discussion and your suggestions have been extremely helpful. Thanks!
 

nmp

Member
Joined
Jan 20, 2005
Messages
1,995
Location
Maryland USA
Format
35mm
Interesting....kind of like digital solarization. I have seen something similar to this in my digital negatives where at times the whitest step is not at k=0, but somewhere close to it - usually within 5-10% or so. I have thought it probably had something do with the printer profile and the possibility that in the densest regions, there might be some variation in the relative proportions of various inks - affecting overall UV absorptivity. The type of rendering intent and whether BPC (Black Point Compensation) is used or not perhaps are also factors, but I have not delved into this issue much to investigate.

Which brings me to the question - are you using a printer profile with Photoshop Manages Color or are you using Printer Manages Color with ABW (if gray scale) to print these step tablets. In the former, you can probably check if there is a reversal of density using soft-proofing or using edit>convert-to-profile function. I have never used ABW so I don't know if it can eb soft-proofed as well.

Kind of curious where this all ends up....please keep sharing!

:Niranjan
 
OP
OP
jisner

jisner

Member
Joined
Sep 16, 2017
Messages
102
Location
Tucson, Arizona
Format
35mm
are you using a printer profile with Photoshop Manages Color or are you using Printer Manages Color with ABW (if gray scale) to print these step tablets

Since I don't normally make negatives with Photoshop (I normally use my QTR printer for that), I'm not 100% sure that I'm using the correct printer settings. For grayscale negatives, I send an Adobe RGB image to the printer and let the printer manage color. Here are my settings:

https://photos.app.goo.gl/F6Qw4feQrMecVYwv7

For this series of measurements, I did not use any of the advanced options, like adding a yellow tint. However I did find (previously) that, while adding a yellow tint increased density somewhat, it has similar problems in the deepest shadows of the negative.

https://photos.app.goo.gl/dBEGcwrZ7ZiWMMer7

Both of these are for 101-step table negatives.
 
OP
OP
jisner

jisner

Member
Joined
Sep 16, 2017
Messages
102
Location
Tucson, Arizona
Format
35mm
Your suggestion that all curves should be a subset of B=0 is intuitively appealing. It means that any other curve can be obtained by translating the B=0 curve to the right (y = f(x) -> y = f(x-b) and then scaling it back into [0,1].

Your idea is working out really well. Starting with my 11-step B=4 TD vs K curve, I did a cubic spline interpolation (in Excel/VBA), adding points every sixth of a stop (0.05 log base-ten) in density. You only need to do this once. From this parent curve, it's trivial to generate any other curve in the family. Since you're working with a table in Excel, it's a simple matter of shifting the rows up or down, then renormalizing the K values into [0,1].

Here's a screenshot of the original B=4 curve (blue) and two curves that I created from it using the above algorithm. The orange curve has a max density range of 1/3 stop less than the blue curve, and the gray curve 2/3 stops less. My computer simulations work in sixths of a stop, which is why I chose this increment. For example, you can simulate what happens if the negative density range is increased/decreased by a given number of sixths of a stop.

https://photos.app.goo.gl/TgiUuukaqcK7itAy5
 

nmp

Member
Joined
Jan 20, 2005
Messages
1,995
Location
Maryland USA
Format
35mm
Since I don't normally make negatives with Photoshop (I normally use my QTR printer for that), I'm not 100% sure that I'm using the correct printer settings. For grayscale negatives, I send an Adobe RGB image to the printer and let the printer manage color. Here are my settings:

https://photos.app.goo.gl/F6Qw4feQrMecVYwv7

For this series of measurements, I did not use any of the advanced options, like adding a yellow tint. However I did find (previously) that, while adding a yellow tint increased density somewhat, it has similar problems in the deepest shadows of the negative.

https://photos.app.goo.gl/dBEGcwrZ7ZiWMMer7

Both of these are for 101-step table negatives.

I see that you are using Absolute Colorimetric as the rendering intent. In all likelihood, this digital solarization is probably (if only partly) related to that. In case of Absolute Colorimetric, the out of gamut tones are simply moved to the edge of the gamut. For example if I look at the Photo Paper Premium Glossy profile on my P400, the edge of the gamut seems to be at about 93%. Any steps above it are not in gamut. If Abs Col is used as a rendering intent, these all will be mapped to the same value as 93%, essentially clipping those tones.

On the other hand, if Relative Colorometric is used with Black Point Compensation (BPC) checked, those tones will be pushed down into the gamut, creating a sort of a toe and adjusting the immediate in-gamut values accordingly. The densest shadows are no longer clipped and the tonal separation is maintained. This would explain why in your case, the Dmax occurs not at K=100 but somewhere before. But it does not explain why the density goes down after reaching the maximum. That could be some other phenomenon.

So, if you like to see if you can have a normal curve for the B=0 case, change the rendering intent to Rel Col with BPC checked and see if there is a difference. I guess you only need to do a few points in 90-100% zone to verify if it is a factor.


:Niranjan.
 
OP
OP
jisner

jisner

Member
Joined
Sep 16, 2017
Messages
102
Location
Tucson, Arizona
Format
35mm
So, if you like to see if you can have a normal curve for the B=0 case, change the rendering intent to Rel Col with BPC checked and see if there is a difference. I guess you only need to do a few points in 90-100% zone to verify if it is a factor.
Good suggestion. I will try it and let you know what happens.
 
OP
OP
jisner

jisner

Member
Joined
Sep 16, 2017
Messages
102
Location
Tucson, Arizona
Format
35mm
with BPC checked
With Relative Colorimetric (in fact with all the rendering intents), BPC is grayed out. You only get to check BPC if Photoshop manages color, and I have been letting the Printer manage color. So should I let Photoshop manage color? The document profile is Adobe RGB and the printer profile is "SC-400 Series Photo Paper Glossy," which I have been using to print transparencies. I'm ready to print, but I'll wait to hear from you. Here are the proposed settings:

https://photos.app.goo.gl/EXWaJjSEJaiZaqiG9
 
Photrio.com contains affiliate links to products. We may receive a commission for purchases made through these links.
To read our full affiliate disclosure statement please click Here.

PHOTRIO PARTNERS EQUALLY FUNDING OUR COMMUNITY:


Ilford ADOX Freestyle Photographic Stearman Press Weldon Color Lab Blue Moon Camera & Machine
Top Bottom