Digital Camera Scanning and Step Wedge Confusion

Forum statistics

Threads
198,993
Messages
2,784,277
Members
99,763
Latest member
bk2000
Recent bookmarks
0
Joined
Feb 28, 2024
Messages
9
Location
Brooklyn, NY
Format
35mm
Hello Photrio,

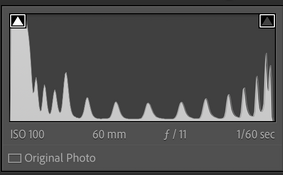
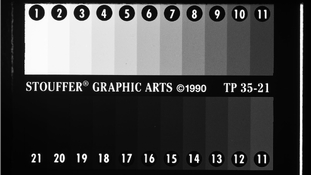
I am working on a calibrated system for previewing darkroom prints via scanning with my digital camera, a Nikon Z5. I ordered a Stouffers step 21 step wedge (10 stops) to help me calibrate. Ignoring my ultimate goal, I think i have a fundumental misunderstanding about how RAW files and digital cameras work. Given that online the Nikon Z5 has a reported 14+ stops of dynamic range, I thought that this would result in plenty of wiggle room when scanning the image (all of the 21 steps compressed into the middle of the histogram, with 2 stops-ish of data on top and bottom). I also expected that each of the 21 steps would be equal distance apart. I have attached a screenshot of the lightroom preview and a screen shot of the histogram (it seems an export is too large for photrio). What you can observe is that the densist steps are all blocked up with little distinction between them, and the steps are much less consistent in how far away they are from each othan i was expecting. This is with the "Adobe monochrome" profile turned on. If I adjust exposure, i can get separation in the shadows.

Can someone explain to me why my assumptions did not turn out to be correct? How can I create a camera capture that shows me what I am expecting? Is this even possible? Thanks!
 

Attachments

  • Screenshot 2025-07-31 at 11.01.28 PM.png
    Screenshot 2025-07-31 at 11.01.28 PM.png
    56.4 KB · Views: 29
  • Screenshot 2025-07-31 at 11.10.33 PM.jpg
    Screenshot 2025-07-31 at 11.10.33 PM.jpg
    110.3 KB · Views: 29

koraks

Moderator
Moderator
Joined
Nov 29, 2018
Messages
23,094
Location
Europe
Format
Multi Format
What you see is basically an S-curve to the entire capture - things get bunched up at both extremes, with separation in the middle. I don't know exactly at what point(s) in your specific workflow this curve is superimposed and/or which fundamental assumptions play a role. Likely several are interacting.

Given that online the Nikon Z5 has a reported 14+ stops of dynamic range, I thought that this would result in plenty of wiggle room when scanning the image (all of the 21 steps compressed into the middle of the histogram, with 2 stops-ish of data on top and bottom)
But how much contrast is there across this range? That's part of what you're running into. The camera may 'see' differentiation very deep down into the shadows, but how much usable signal is there to begin with? In practice, the 14 stops may be a stretch for this particular purpose, where you're also burdening the imaging system with potential edits and contrast enhancements later on in the process. So I wouldn't put too much stock in this number. It's likely a whole lot less. Fortunately, that's OK, because the useful range of B&W negatives is usually far less than those 21 steps (3.15 logD at .15 steps). What you need to capture with some fidelity in the real world is probably something like a 2.5logD range, and that's already stretching it deep into very dense sunlit clouds in your negs. That's already 2 stops less, and as said, it's already a stretch of what you really need.

As to calibration, I generally follow Calvin Grier's preference of using Lab color space. In Lab, a + b encode for color, so you don't need those now. L* stands for lightness and is conceived to give visual or perceptual 'linearity'. This means that equally spaced intervals on the L* axis we feel/perceive as equal steps in terms of brightness. As a starting point for your linearization, you could construct a curve that turns your Stouffer step tablet into equally spaced intervals on the L*-scale. This is kind of quick & dirty and there are numerous ways to attack this approach, but it'll give you a starting point for the edits you'll do later on anyway.

Keep in mind that a theoretical 'absolute', linear capture doesn't really make as much sense as you might think at first hand. Linearity breaks down as soon as you realize how many conversions the densities on the Stouffer go through until you see them on a computer monitor, and how non-linear these need to be for you to perceive them as linear (!) Likewise, these non-linearities are also present in analog printing processes; you rarely, if ever, see a linear translation of a negative to a print - especially in the shadows and the highlights, where both film and paper are non-linear. So the question also becomes what you're 'calibrating' against. If you were to do some kind of calibration (which is not the same in my mind as linearization, which you seem to be aiming for now), you'd probably pick something like the transfer curve of a grade X printing paper of your choice. With the grade being another question mark, as is the specific paper you have in mind. Keep in mind that if you're making a contact sheet of your negatives, the non-linearities of both film and paper are there, too.

In the end, things will turn out to become exceedingly complex if you want to do this 'properly' - so my advice would be to not even try, and instead be pragmatic. Capture your negatives with your photographic setup so that you have separation where you need it. This is an area where 'expose to the right' makes sense as it'll make the most use of the dynamic range of the camera sensor; just be sure to not blow out any of your shadows (i.e. thin parts of the negative). From that point onward, pull whatever sliders you need to get a pleasing outcome. There's no objectively correct result. Keep this in mind as you proceed. It's all interpretation anyway, so you might as well embrace that early on in the process.
 

koraks

Moderator
Moderator
Joined
Nov 29, 2018
Messages
23,094
Location
Europe
Format
Multi Format
PS: coincidentally, there's this other thread going on at the moment about densities in the zone system, where @RalphLambrecht has kindly posted his personal aim densities for negatives, prints and monitor lightness: https://www.photrio.com/forum/threads/negative-density-in-zone-system.215081/post-2917428

I've plotted these densities in the chart below, normalizing everything to a 0-100 scale, and also inverting the negative densities so the pattern becomes more intuitive to grasp:
1754029697342.png

As you can see, the negative densities follow a nearly (but not quite!) linear relationship with the zones. The output densities (print and monitor) are strongly S-curved, as this is what makes things look natural/normal to us. Lots of compression in highlights and shadows, and only limited linearity somewhere in the middle.

While it's of course not a full explanation, I hope the illustration above helps to highlight the point I tried to make that attempting to linearize the process is not really a useful requirement IMO.
 
OP
OP
Joined
Feb 28, 2024
Messages
9
Location
Brooklyn, NY
Format
35mm
@koraks thank you so much for the long and detailed reply. I think it might help to explain my end goal a little more so that you can understand what my requirements are. I would like to develop a piece of software that can accurately predict how a negative will print in the darkroom on a specific paper (standardizing on ilford multigrade rc pearl right now). I would like like th end flow to be to scan a negative, select a paper, and then you can adjust exposure on the monitor and the preview image will show what the print will look like. I am planning on accomplishing this by mapping the densities of the negative to this step wedge, and then mapping the step wedge to the paper using a linear transformation. I will worry about the non linearities of the darkroom paper at a later time.

I think I can still proceed with this since I'm seeing around 10ish steps of linearity in the capture, which will be more than enough for grade 2+ paper at the minimum. But I think I need to adjust the digital capture exposure in order to push the area with the least density further into the middle, so that I can achieve linearity from that point on. (Printable) negatives are much more likely to have areas closer to no density than max densitiy (in my experience).

My motivation for this is that I enjoy the end result of darkroom printing, but not as much the actual process. I also have limited access to my darkroom, so want to make the most of my time there. So knowing roughly the grade to print at without any adjustments would be very helpful.
 

runswithsizzers

Subscriber
Joined
Jan 19, 2019
Messages
1,762
Location
SW Missouri, USA
Format
Multi Format
I would like to develop a piece of software that can accurately predict how a negative will print in the darkroom on a specific paper (standardizing on ilford multigrade rc pearl right now). I would like like th end flow to be to scan a negative, select a paper, and then you can adjust exposure on the monitor and the preview image will show what the print will look like.
That sounds really cool, and I wish you good luck with your project. I am sure you will learn a lot along the way, and perhaps something useful will come from it. However, the problem for me is the disconnect between what I see when I look at a print and what I see when I look at my monitor. My mind cannot reconcile the differences between transmitted light and reflected light. A paper print viewed in room light does not look like that same print when accurately reproduced on my monitor. Similar, yes, but different enough to make meaningful comparisons very difficult (for me).

So knowing roughly the grade to print at without any adjustments would be very helpful.
Writing software to spit out a paper grade number based on the range of densities on the negative might be more doable, I don't know???

You say you are using multigrade paper, right? Have you tried split grade printing?
 
OP
OP
Joined
Feb 28, 2024
Messages
9
Location
Brooklyn, NY
Format
35mm
That sounds really cool, and I wish you good luck with your project. I am sure you will learn a lot along the way, and perhaps something useful will come from it. However, the problem for me is the disconnect between what I see when I look at a print and what I see when I look at my monitor. My mind cannot reconcile the differences between transmitted light and reflected light. A paper print viewed in room light does not look like that same print when accurately reproduced on my monitor. Similar, yes, but different enough to make meaningful comparisons very difficult (for me).


Writing software to spit out a paper grade number based on the range of densities on the negative might be more doable, I don't know???

You say you are using multigrade paper, right? Have you tried split grade printing?

Thank you for your well wishes. I agree with you about the fine differences of evaluating a print vs a digital image on a screen, however I am talking much more generally than that. Often I go into the darkroom and hope to print an image only to find that it is not easily printable with the contrast grade that offers the kind of local contrast that makes the image nice. I will do contact sheets, but I find it difficult to judge from the tiny 35mm contact print. Often i enlarge only to find that my negative is way off, and would take a much more experienced printer than me to get a great image out of it using extensive dodging and burning with split grade printing. I don't think I have a single negative worth all of that headache. My interest is in quickly being able to iterate on my exposure/development to yield easily printable negatives. This is tough with limited darkroom time and money.

Also take into account that I am software engineer by day, so the actual usefulness of the end result is not the only objective. I'm also trying to refine and expand my software engineering skills in the domain of a hobby that I enjoy.
 

koraks

Moderator
Moderator
Joined
Nov 29, 2018
Messages
23,094
Location
Europe
Format
Multi Format
@cakescakescakes for your purpose it'll suffice to 'simply' linearize your digital capture. I.e. make a setup that you can consistently replicate in terms of exposure, then calibrate/linearize it using your Stouffer step tablet(s) so you have the numerical relationship between negative density and the pixel values in your digital capture. It's a fun project and you'll learn many things in the process. One of the things you'll likely realize along the way that the utility is more in that learning aspect than in actually using the tool you'll end up with. But I'll leave that up to you to find out for yourself.
 
OP
OP
Joined
Feb 28, 2024
Messages
9
Location
Brooklyn, NY
Format
35mm
@koraks I agree. In a practical sense, I suppose this means creating a preset in lightroom that along with my calibrated setup will be able to do the mapping. And then I can export into a jpeg to use in my own software. Eventually I would like to cut lightroom out entirely, but one thing at a time. I think I have everything I need to get started on the next step of the project. Thank you so much for your feedback and I will return later with results (hopefully)!
 

koraks

Moderator
Moderator
Joined
Nov 29, 2018
Messages
23,094
Location
Europe
Format
Multi Format
Yes, indeed; you could do the whole thing in Lightroom with an adjustment curve. Alternatively, you could take the values straight from your camera raw file and then do the calculus on those data in your own software. The starting point for both would be to create a table that records digital values for each density step. Based on that, you can make an adjustment curve that simulates the paper - either in Lightroom or in your own software. Lightroom can be nice to do a mockup of the process before you start coding.
 

ArnoG

Member
Joined
Dec 14, 2024
Messages
3
Location
Netherlands
Format
35mm
You need a linear import profile. What LR provides is not linear, but designed to look pretty. Google linear import profile and find out how you can make your own for your camera. Negative Lab Pro also works with it’s own linear profile, which might be better than what you can create yourself since Adobe does a lot behind our backs during import. There’s software that enables you to look at the real raw data. It’s called “RAW Digger”. I went down the same rabbit hole as you, trying to link the digital to the analog space and wrote my findings in my blog here: https://www.arnogodeke.com/Blog/Zone-system-calibration
 
OP
OP
Joined
Feb 28, 2024
Messages
9
Location
Brooklyn, NY
Format
35mm
@ArnoG wow, i look forward to reading that post in detail. I have NLP and can see its many profiles, but which one(s) are linear? There are many. I haven't upgraded NLP in a long time, so perhaps thats the issue.
 

ArnoG

Member
Joined
Dec 14, 2024
Messages
3
Location
Netherlands
Format
35mm
@ArnoG wow, i look forward to reading that post in detail. I have NLP and can see its many profiles, but which one(s) are linear? There are many. I haven't upgraded NLP in a long time, so perhaps thats the issue.

The profile that is linear is “Negative Lab v2.3” or “Negative Lab v2.3 B&W”, which is what NLP uses as default when you activate it. Try applying that profile to your Z5 pics and see if that helps removing the S-curve which Adobe applies during import. I iterated with the NLP developer (Nate) a bit about linearity in LR and according to him there’s more done than just the import profile. Hence, I’m using the NLP profile if I want to import linear, even when I also created my own.
 
Photrio.com contains affiliate links to products. We may receive a commission for purchases made through these links.
To read our full affiliate disclosure statement please click Here.

PHOTRIO PARTNERS EQUALLY FUNDING OUR COMMUNITY:


Ilford ADOX Freestyle Photographic Stearman Press Weldon Color Lab Blue Moon Camera & Machine
Top Bottom