Hi Michael
Thanks for your interest and suggestions, which I shall take into consideration for future attempts. Here is a more detailed description of my methodology.
I created a "test target" consisting of an A3 sheet of white paper cut down to fit the maximum enlargement size that can be projected by my enlarger using the standard 80mm lens onto the baseboard. The target had a vertical line in the middle dividing it into left and right sides, and two circles about 50mm diameter, one on each side of the central line and equidistant from it, and was taped to the baseboard. I used the circles (on the exposed negatives) as an indication of where on the negative the density should be measured, so I would be measuring it in the same place on each frame. Before starting, I used the light meter with lab attachment to confirm that the two circles both received the same illumination with the enlarger lens set to f/5.6.
I set my Bronica ETRSi up on a tripod with the 75mm f/2.8 lens at close focus distance, pointing down at the target at approximately a 45 degree angle. Due to the foreshortening of the target, the entire width of the frame was filled by the target, but only about 3/4 of the vertical height, which I centered in the frame. The lens was focused so the two circles were in focus.
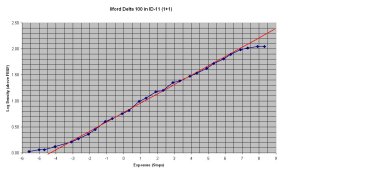
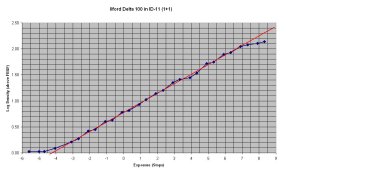
I used one 15-exposure roll. Because I wanted a long enough exposure range to see the shoulder, as well as half stop resolution, I made two exposures on each frame. (This may have been a mistake - but was done because I have a limited supply of film and chemicals, and every film I use in this way is one I can't shoot pictures with!) So for example, for my first exposure I exposed the whole target at 1/15". I then placed a sheet of black card over the right hand half of the target and exposed again at 1/30". This gave me two exposures, one of 1/15" and one of 1/10". Not exactly a half stop apart, but close enough to provide an intermediate value. For the next frame I doubled these times to 1/8" for the entire target plus an additional 1/15" with the right hand side covered by black card. And so on, up to 1024" + 512" for the last frame. (I messed up one of the exposures, so there is a data point missing between -4 EV and -3 EV on the graph.)
The camera lens was set to f/5.6 as was the enlarger lens since I felt this offered the best compromise between light fall-off (which could make the measured value overly dependent on where it was measured on the negative) and reciprocity failure. I had previously measured reciprocity failure on Delta 100 and found it to be inconsequential at Zone V density level for exposures of 16 seconds and less. Since reciprocity is dependent on the light level not the exposure time it made sense to me that, provided the light level was significantly more than required to give a Zone V exposure time of 16 seconds, reciprocity should not affect the result. The metered exposure (using a spot meter located where the camera would be and pointed at one of the measurement circles on the target) was 3.2" at f/5.6 (ISO 100). Given my previous measurement of reciprocity failure, I figured this was OK although it would have been nicer to have shorter exposures if possible (but then I would have struggled to create a uniformly illuminated target). Note that if reciprocity failure did affect the result, then it would do so by shifting the entire curve on the X axis since the same illumination level was used for all points on the curve (and hence the rate of latent image formation would have been the same even if reciprocity failure had reduced it somewhat).
I then developed the film as carefully as possible to get the timing, temperature and agitation as accurate as possible. I used a plastic tank (which is all I have) and immersed it in a water bath at 18 C during development because I have found that this helps compensate for hand warmth etc when inverting. I measured the temp of the developer when it came out of the tank and it was 20.2 C (it went in at 20 C).
Once the negs were dry, I used the enlarger to project them onto my printing easel at approx. 8 x 10" size. I then used the light meter's LAB attachment to measure the intensity of the projected image within the measuring circle on each side of the negatives. This measurement was made in EV, and were in the range +4.3 to -2.6 EV with the meter set for ISO 100. I also measured the illumination with a section of the leader that had not been exposed in the enlarger, to give me a FB&F reference. The illumination values were normalized to the FB&F measurement and then converted to log10 density values. The chart X values were calculated from the actual exposure times by normalizing to 3.2" (the metered exposure) and then finding the log (base 2).
One possibility for the flattening of the top of the curve is it could be related to the response of the meter that I used for measurement. The meter is rated to -4 EV at ISO 100, but it is possible that it's response is not accurate for light levels as low as -2.6 EV or that the slight spill-over from the enlarger illumination source was affecting the reading. The enlarger is shrouded by a black cloth that is hung over it like a tent, but one side (where I stand) is open, and there is a bit of light leakage out of the color head. I can try making the measurements again with the projected image size reduced to say 4 x 5", which would increase the intensity by 2 EV and should show if the low light level is affecting the measurement.
Cheers
Andrew


